Settlement & Closing
Mortgage shifts in 2026: three key trends impacting title companies
By Andy Walden, Head of Mortgage and Housing Market Research, ICE
March 5, 2026
The mortgage market is rarely static, but the landscape entering 2026 presents a unique paradox for title professionals. We’re seeing a market that is grappling simultaneously with rising distress in specific sectors and budding opportunity in others. For title companies, this creates an environment where operational agility is paramount.
Understanding these distinct market themes is critical for title agencies looking to allocate resources effectively and capture market share.
ICE manages a leading repository of loan-level residential mortgage data and performance information covering the majority of the overall market. In addition, the company maintains one of the most robust public property records databases available, covering approximately 99.9% of the U.S. population and households from more than 3,100 counties.
ICE’s research experts carefully analyze this data to produce a summary supplemented by dozens of charts and graphs that reflect trend and point-in-time observations for the monthly Mortgage Monitor report.
Data gathered in the February 2026 Mortgage Monitor report highlights three specific trends — rising defaults, a rise in refinance activity and a shift in equity usage — that will directly influence order volume and workflow in the coming months. Read on to discover how these trends are shaping the title business and where opportunities for growth lie.
1. The gradual rise in default and foreclosure activity
After years of historic lows, the default landscape is shifting, with active foreclosures rising by more than 20% YoY — activity that needs to be monitored closely by title companies specializing in default services (Graph A).
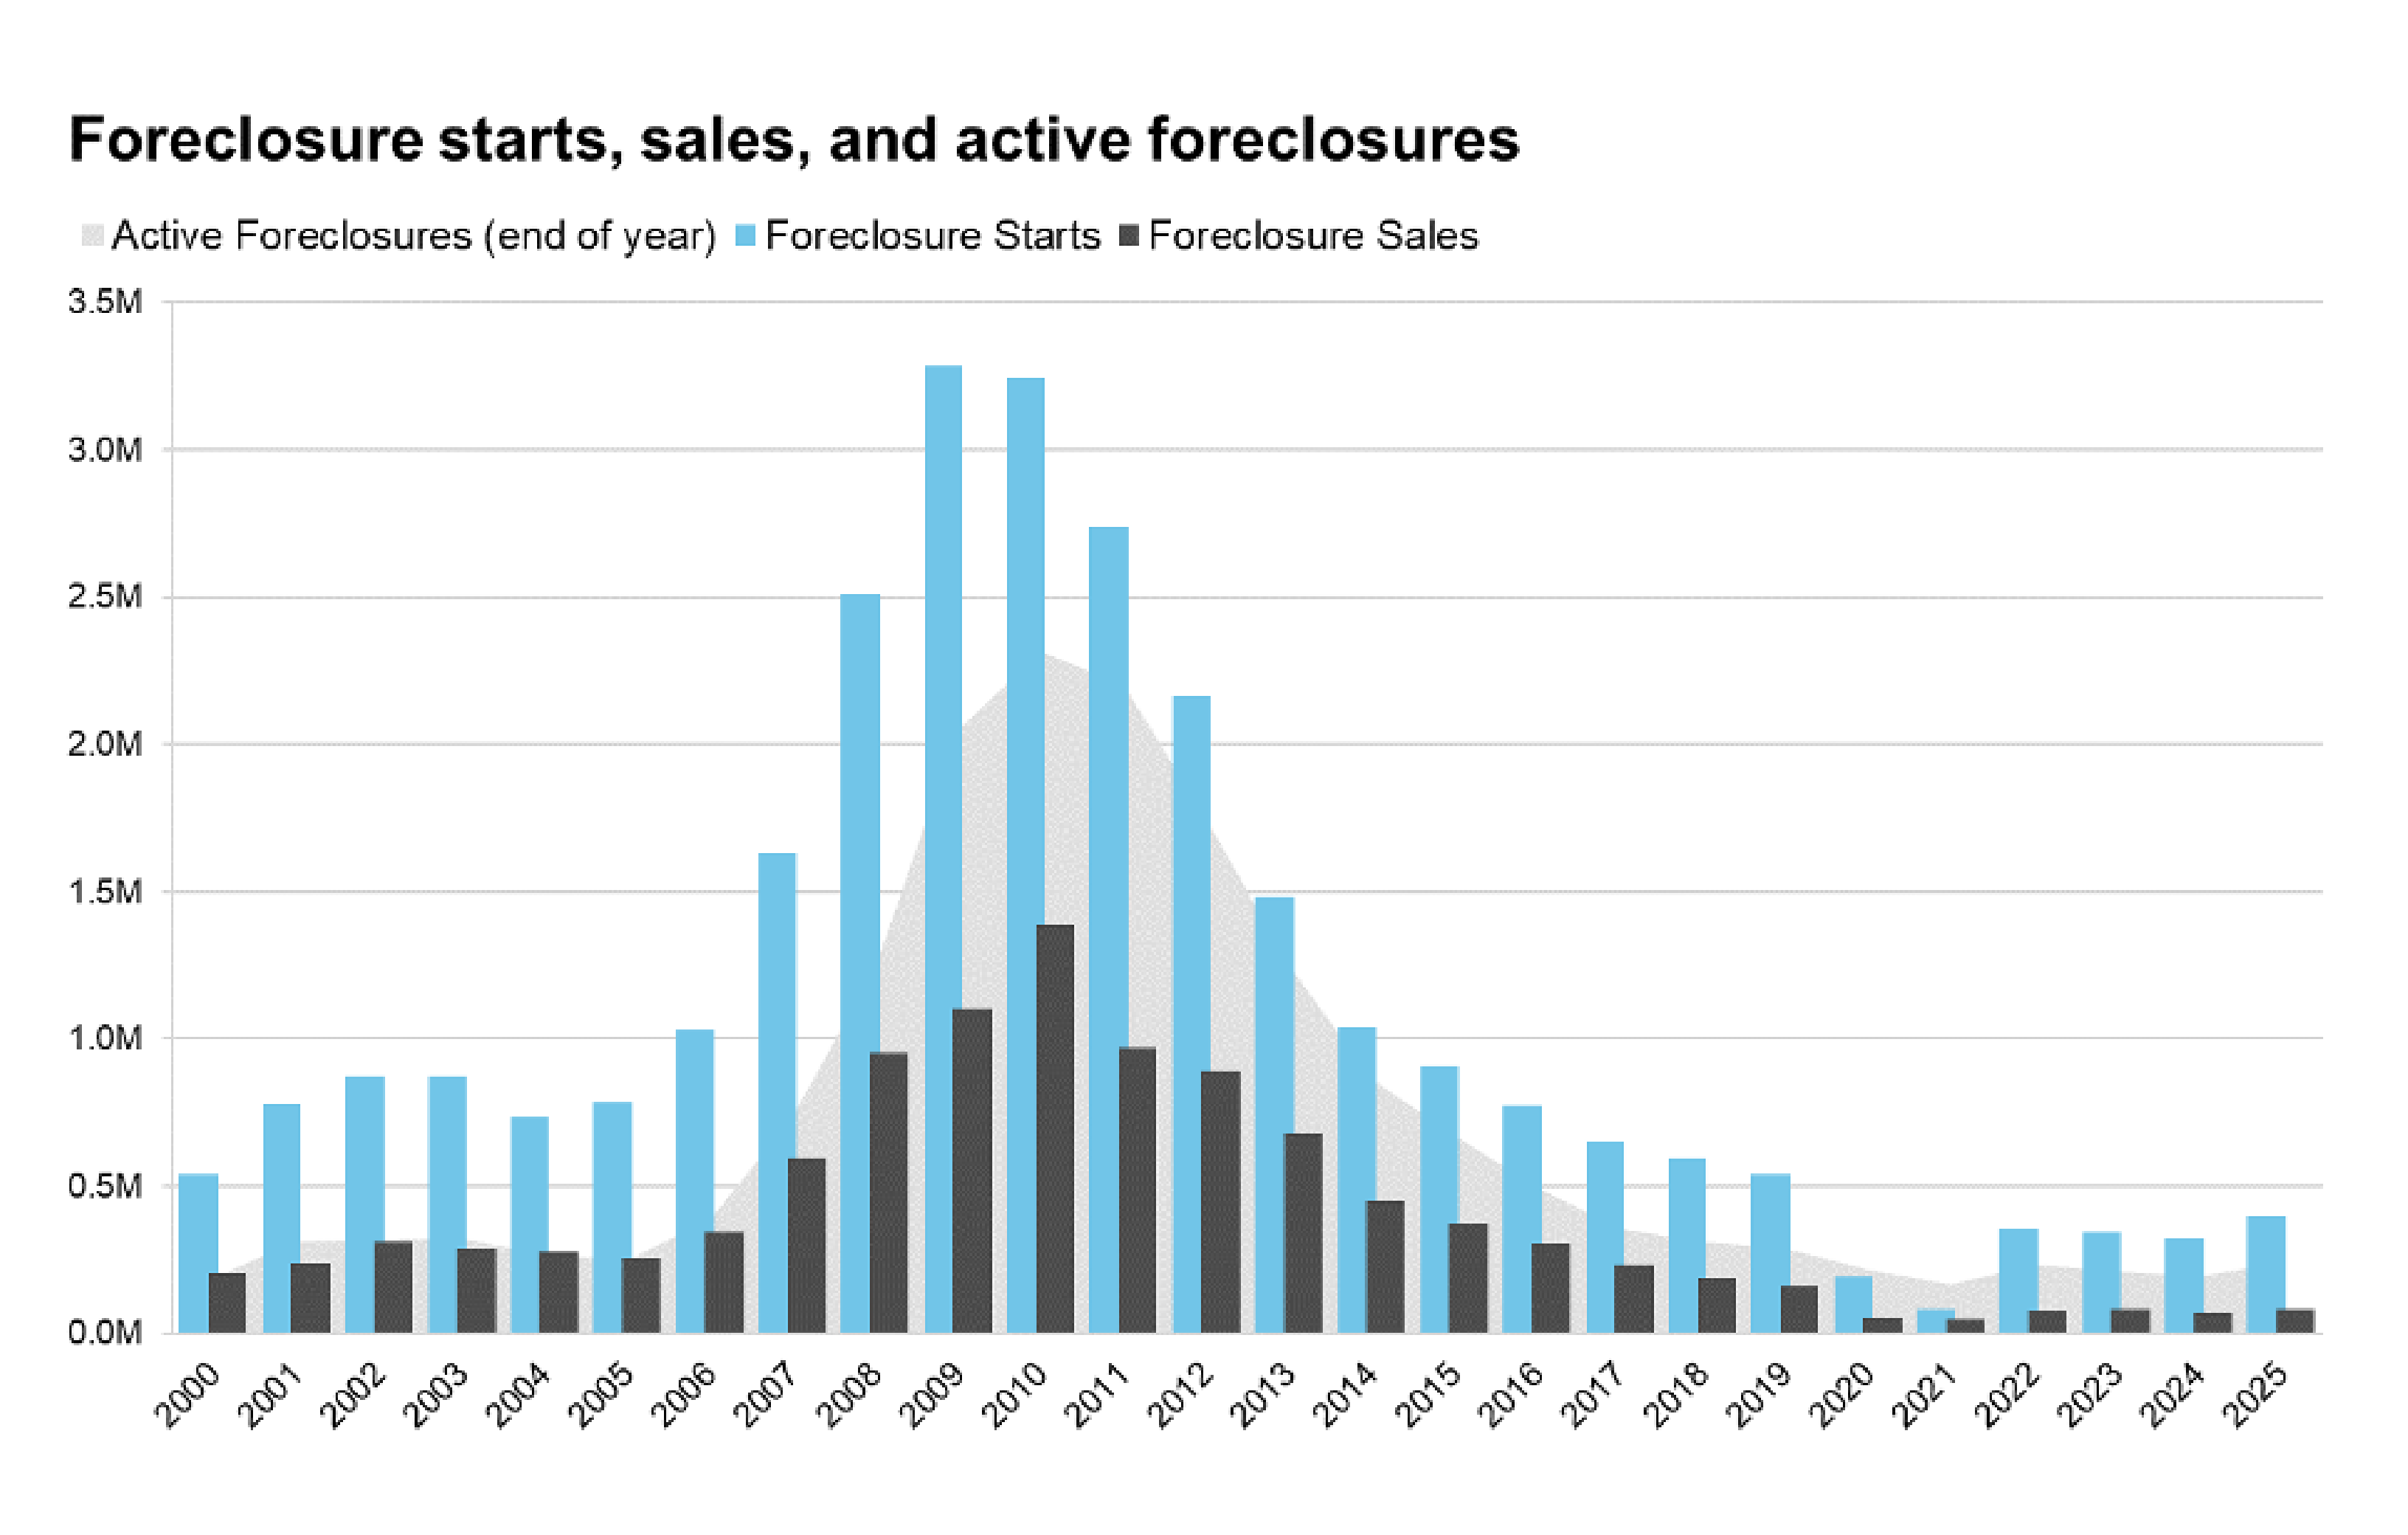
Graph A - Source: ICE McDash
While early-stage delinquencies, those 30 or 60 days past due, trended lower to start 2026, later stage delinquencies and active foreclosures continue to rise. In fact, the number of loans 90 or more days past due, or in active foreclosure, has risen by 148,000 (+21%) over the past 3 months alone, hitting its highest non-pandemic levels since mid-2018. Roughly 80% of that rise has come from FHA loans, which remain a focal point for the market in 2026 (Graph B).
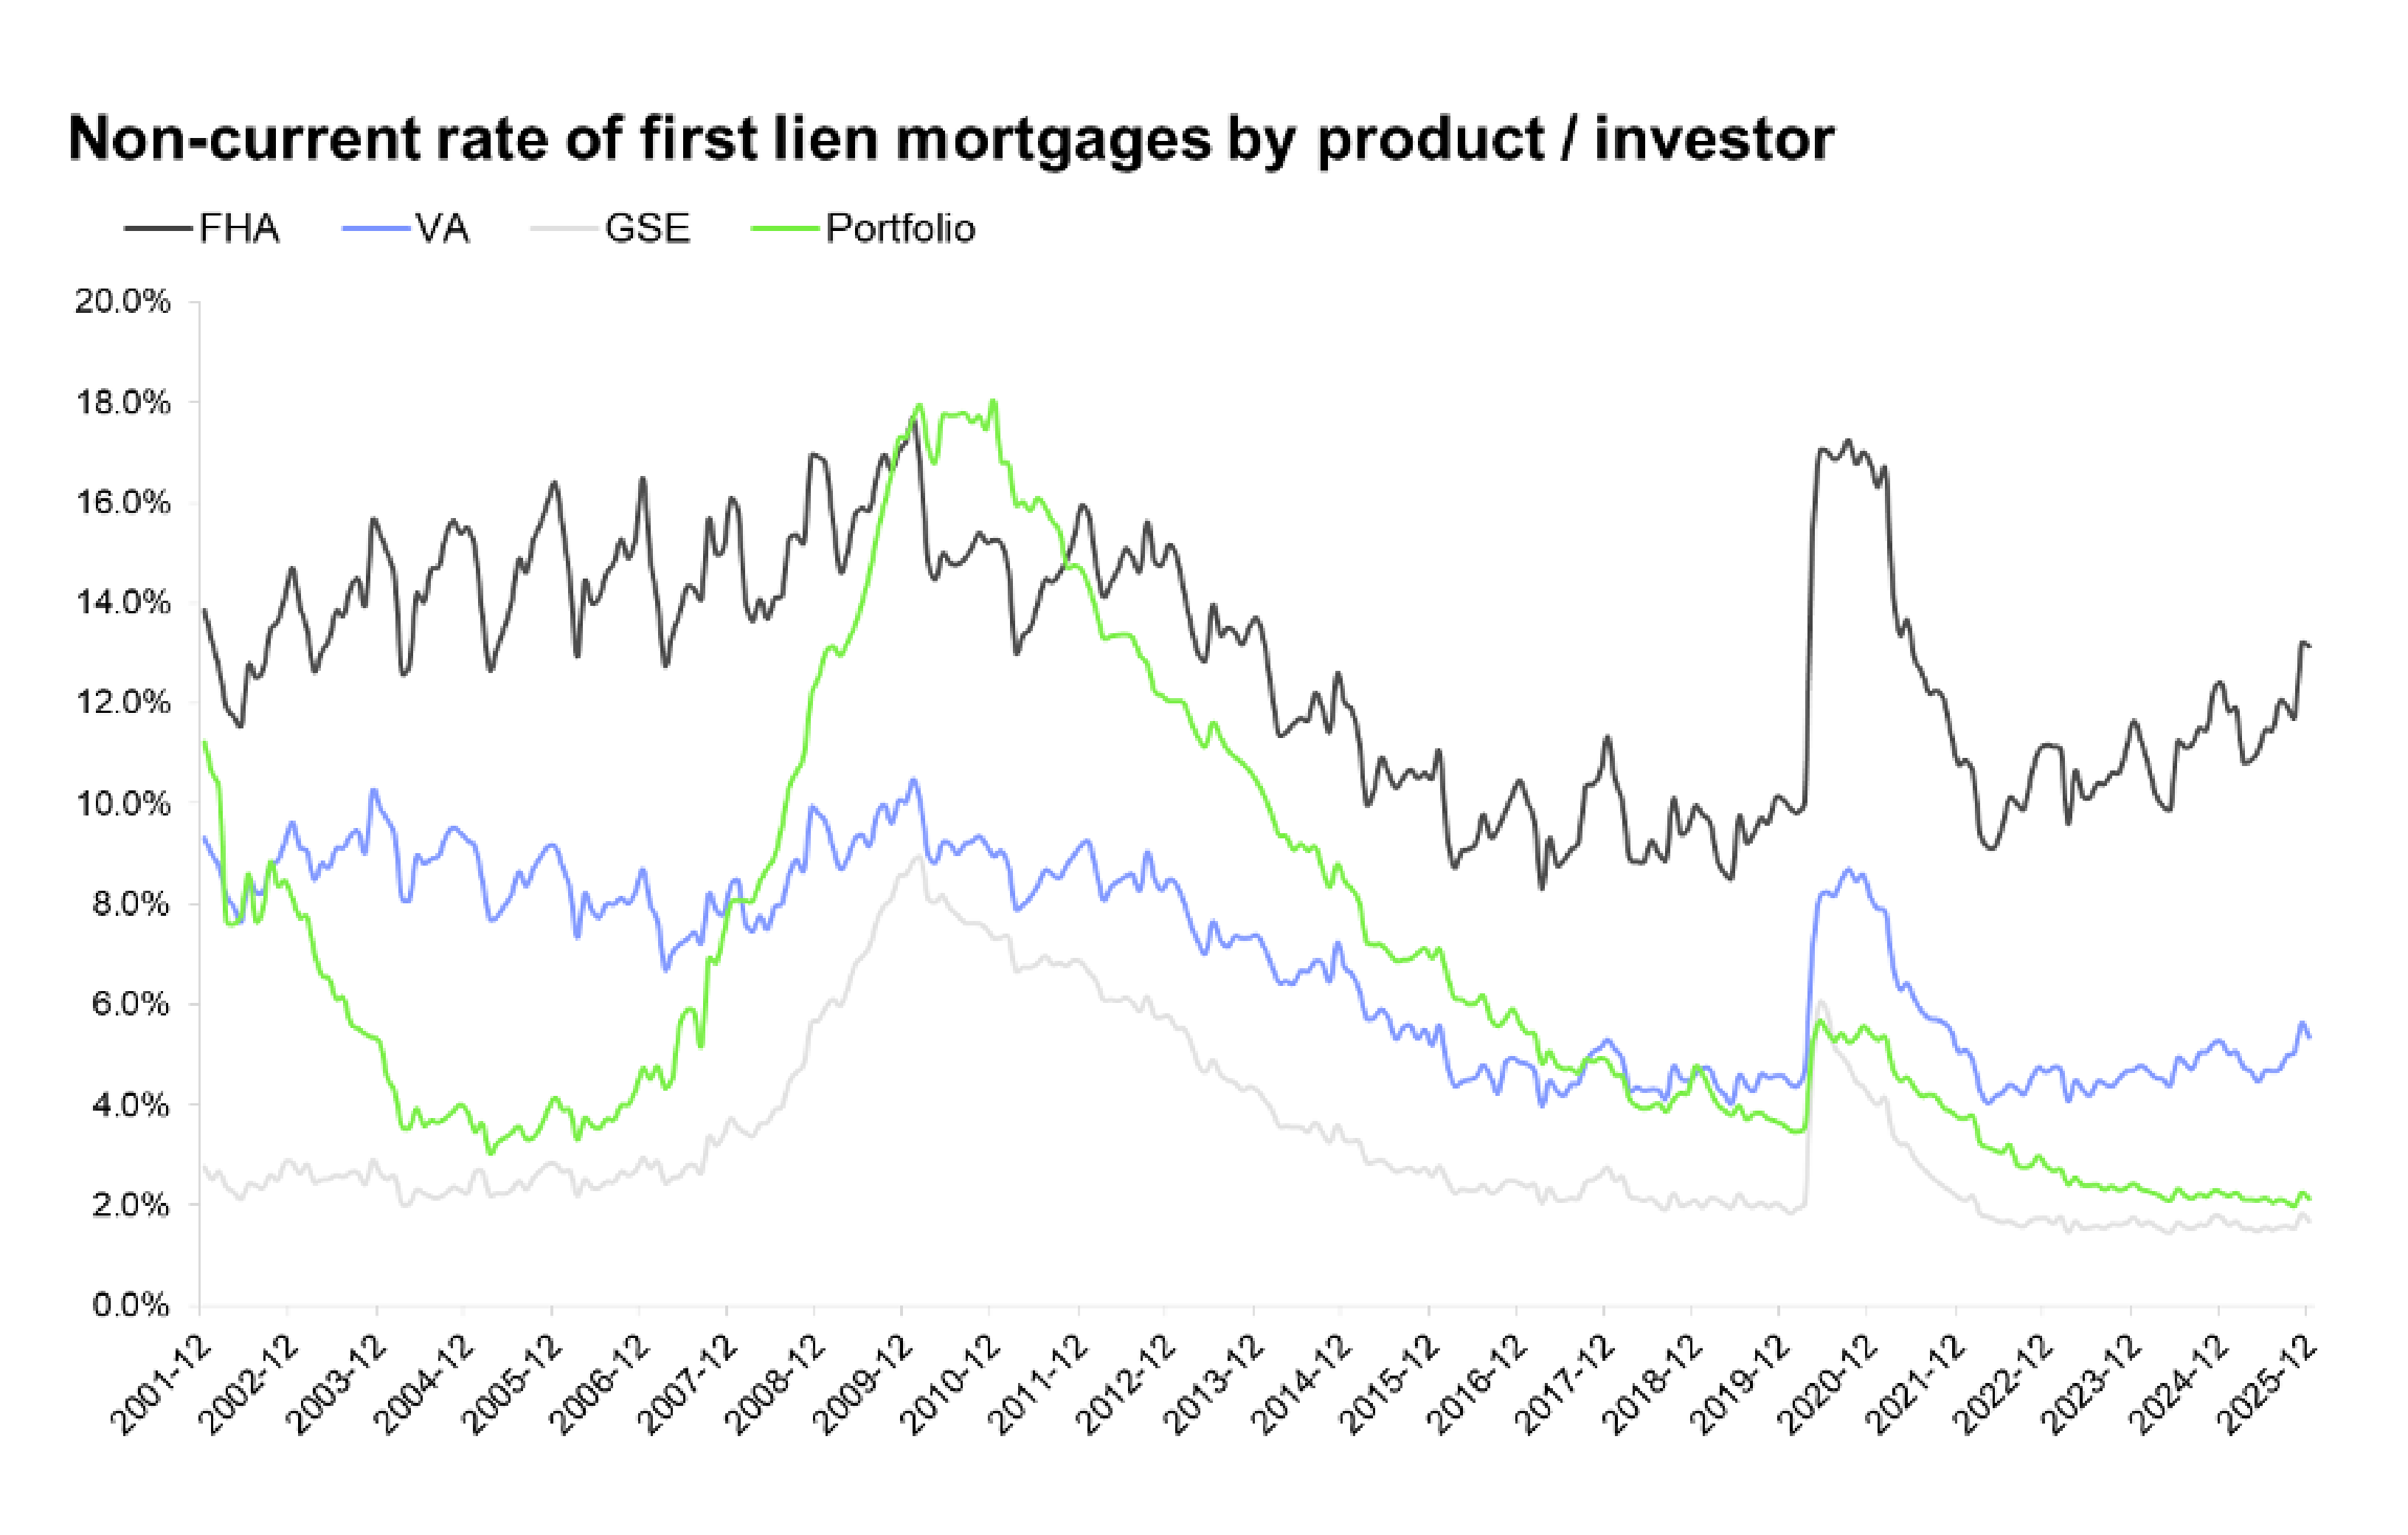
Graph B* - Source: ICE McDash
For title companies, the implications are significant. This signals a growing pipeline of default title work, from initial foreclosure commitments to REO (Real Estate Owned) title services. Title companies that deliver truly end‑to‑end services may be positioned to capture greater market share, as lenders and servicers increasingly prioritize partners who streamline operations and reduce the number of vendors they must manage.
Navigating loss mitigation shifts
New loss mitigation guidelines bring early shifts in loan flow as servicers utilize short-term repayment plans to gauge borrower capacity. This may result in a temporary stall in foreclosure starts followed by a sudden influx if these plans fail. Title companies with their hands in the default space should prepare for this potential volatility by ensuring their staffing and automated search capabilities are scalable.
2. A targeted refinance rebound
While distress is rising in one corner of the market, opportunity is expanding in another. The recent announcement that Government-Sponsored Enterprises (GSEs) have been directed to begin purchasing $200 billion of Mortgage-Backed Securities (MBS) has altered the interest rate outlook.
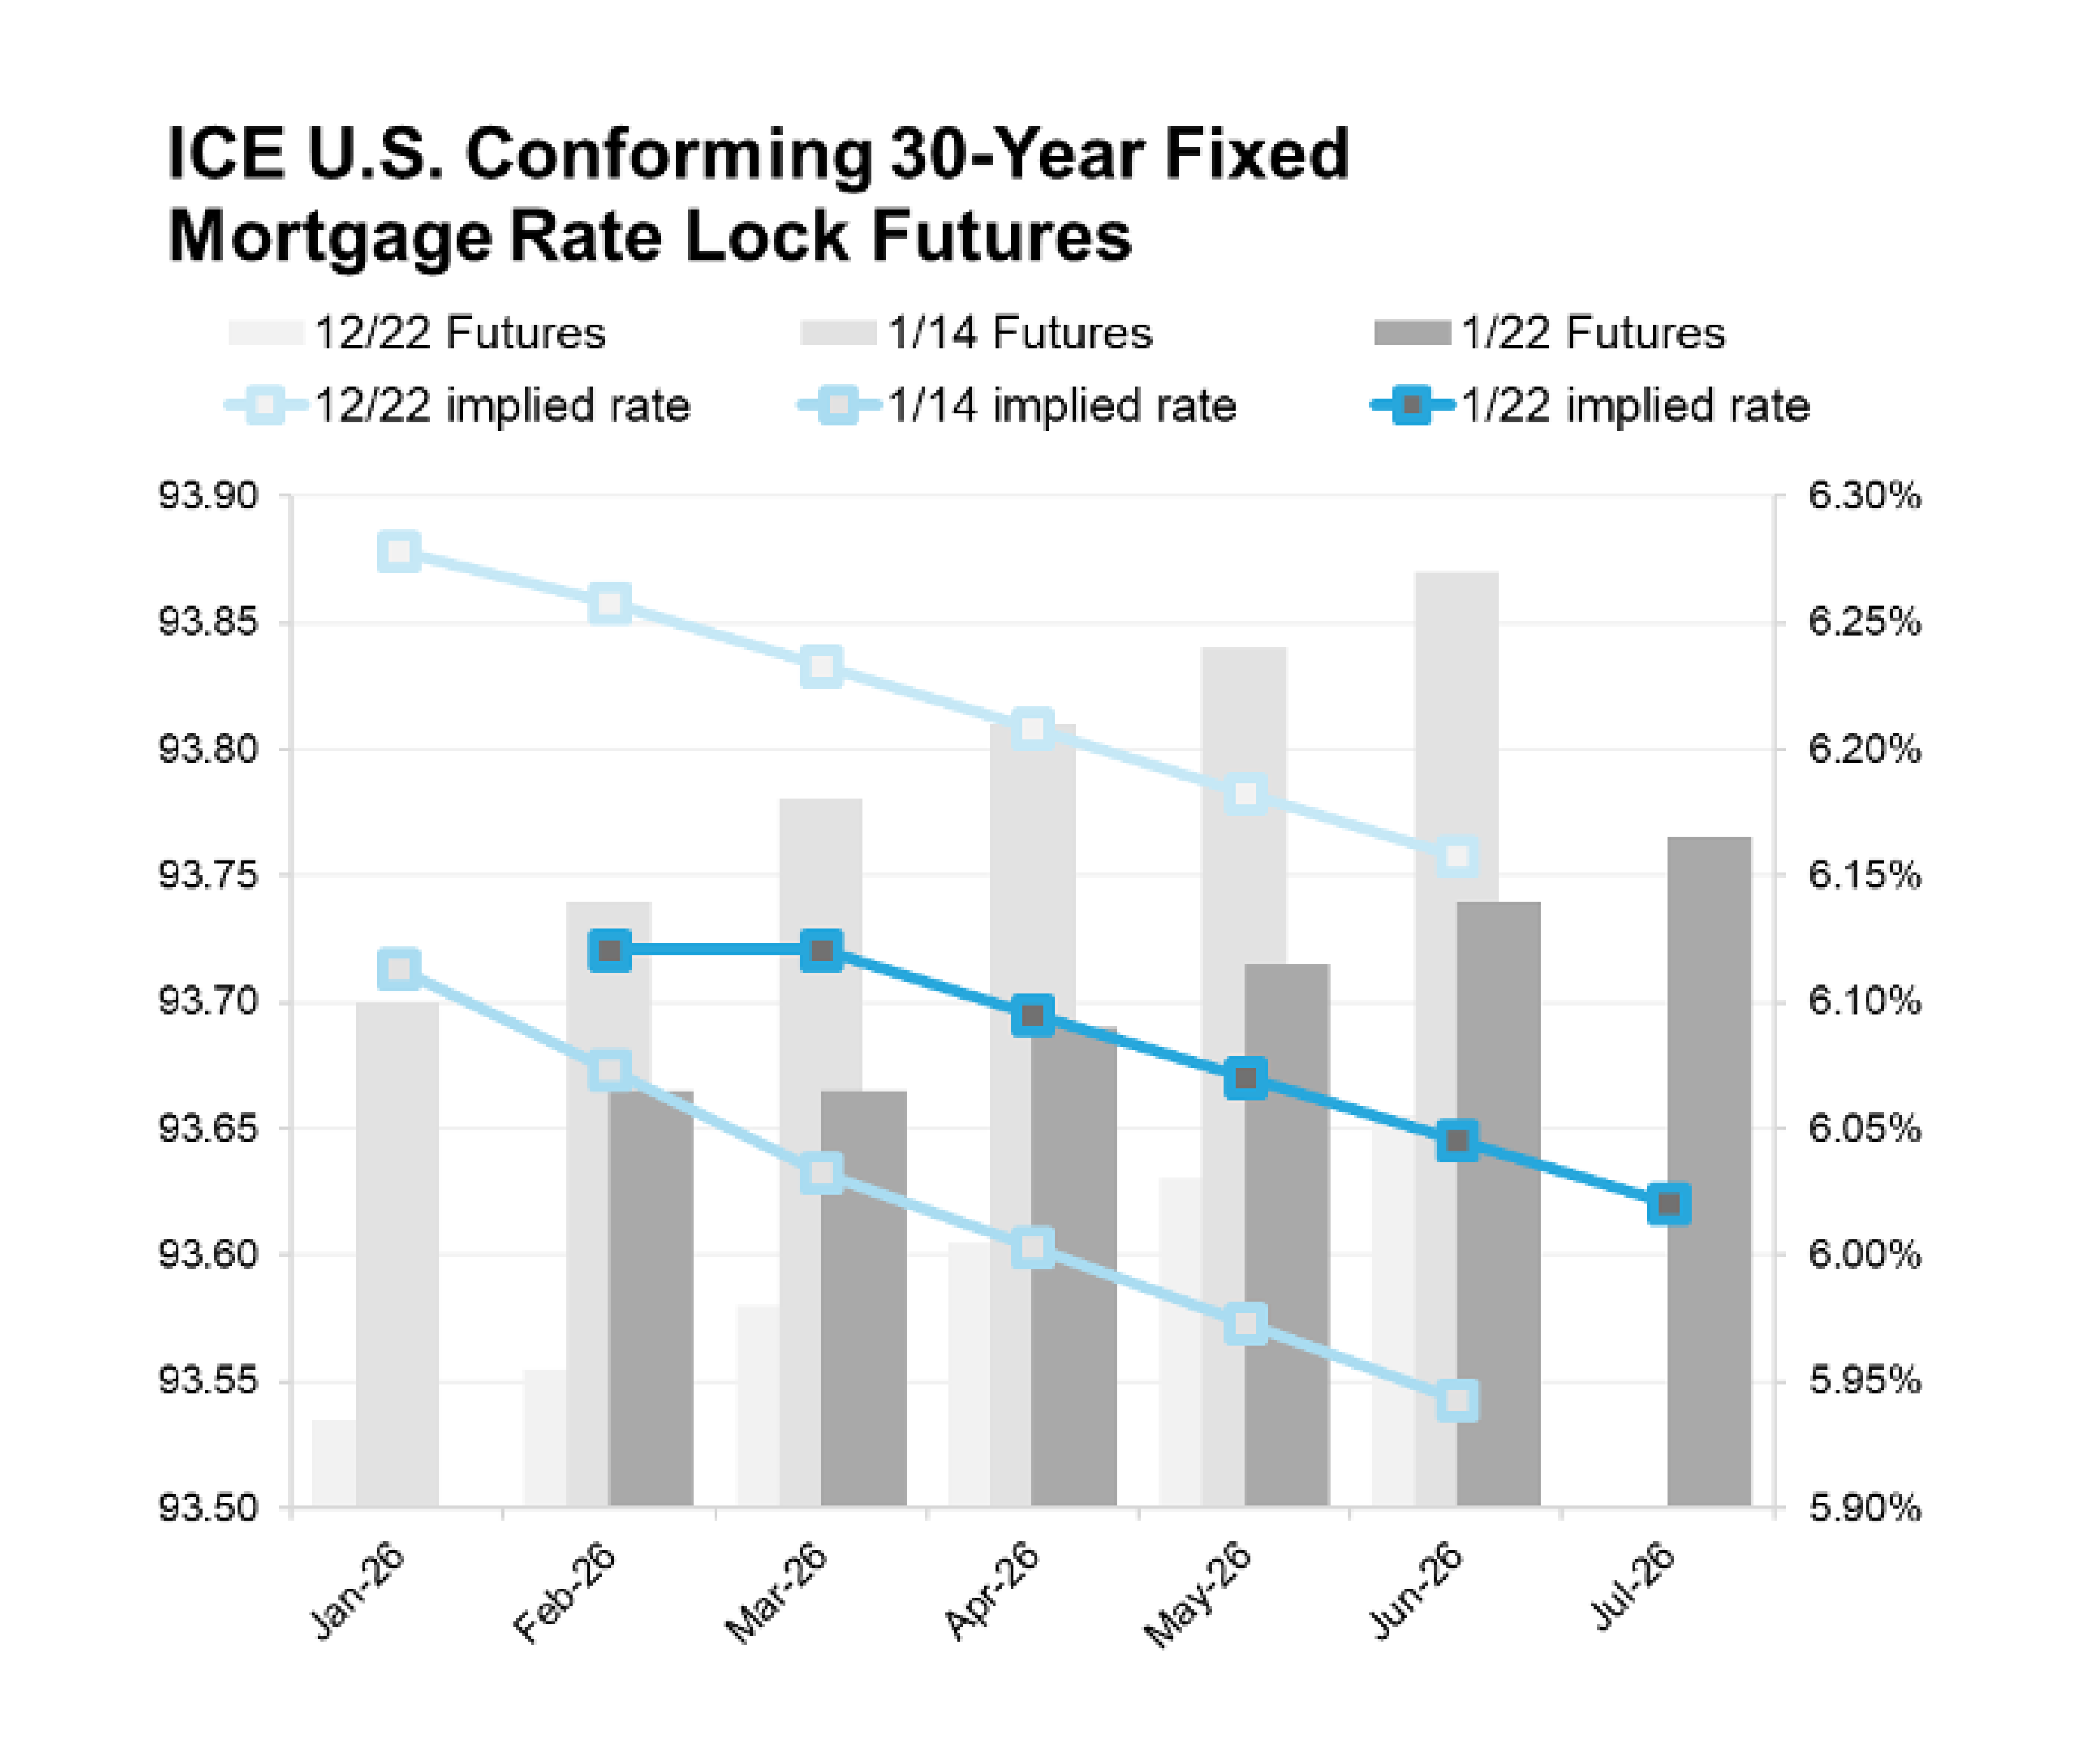
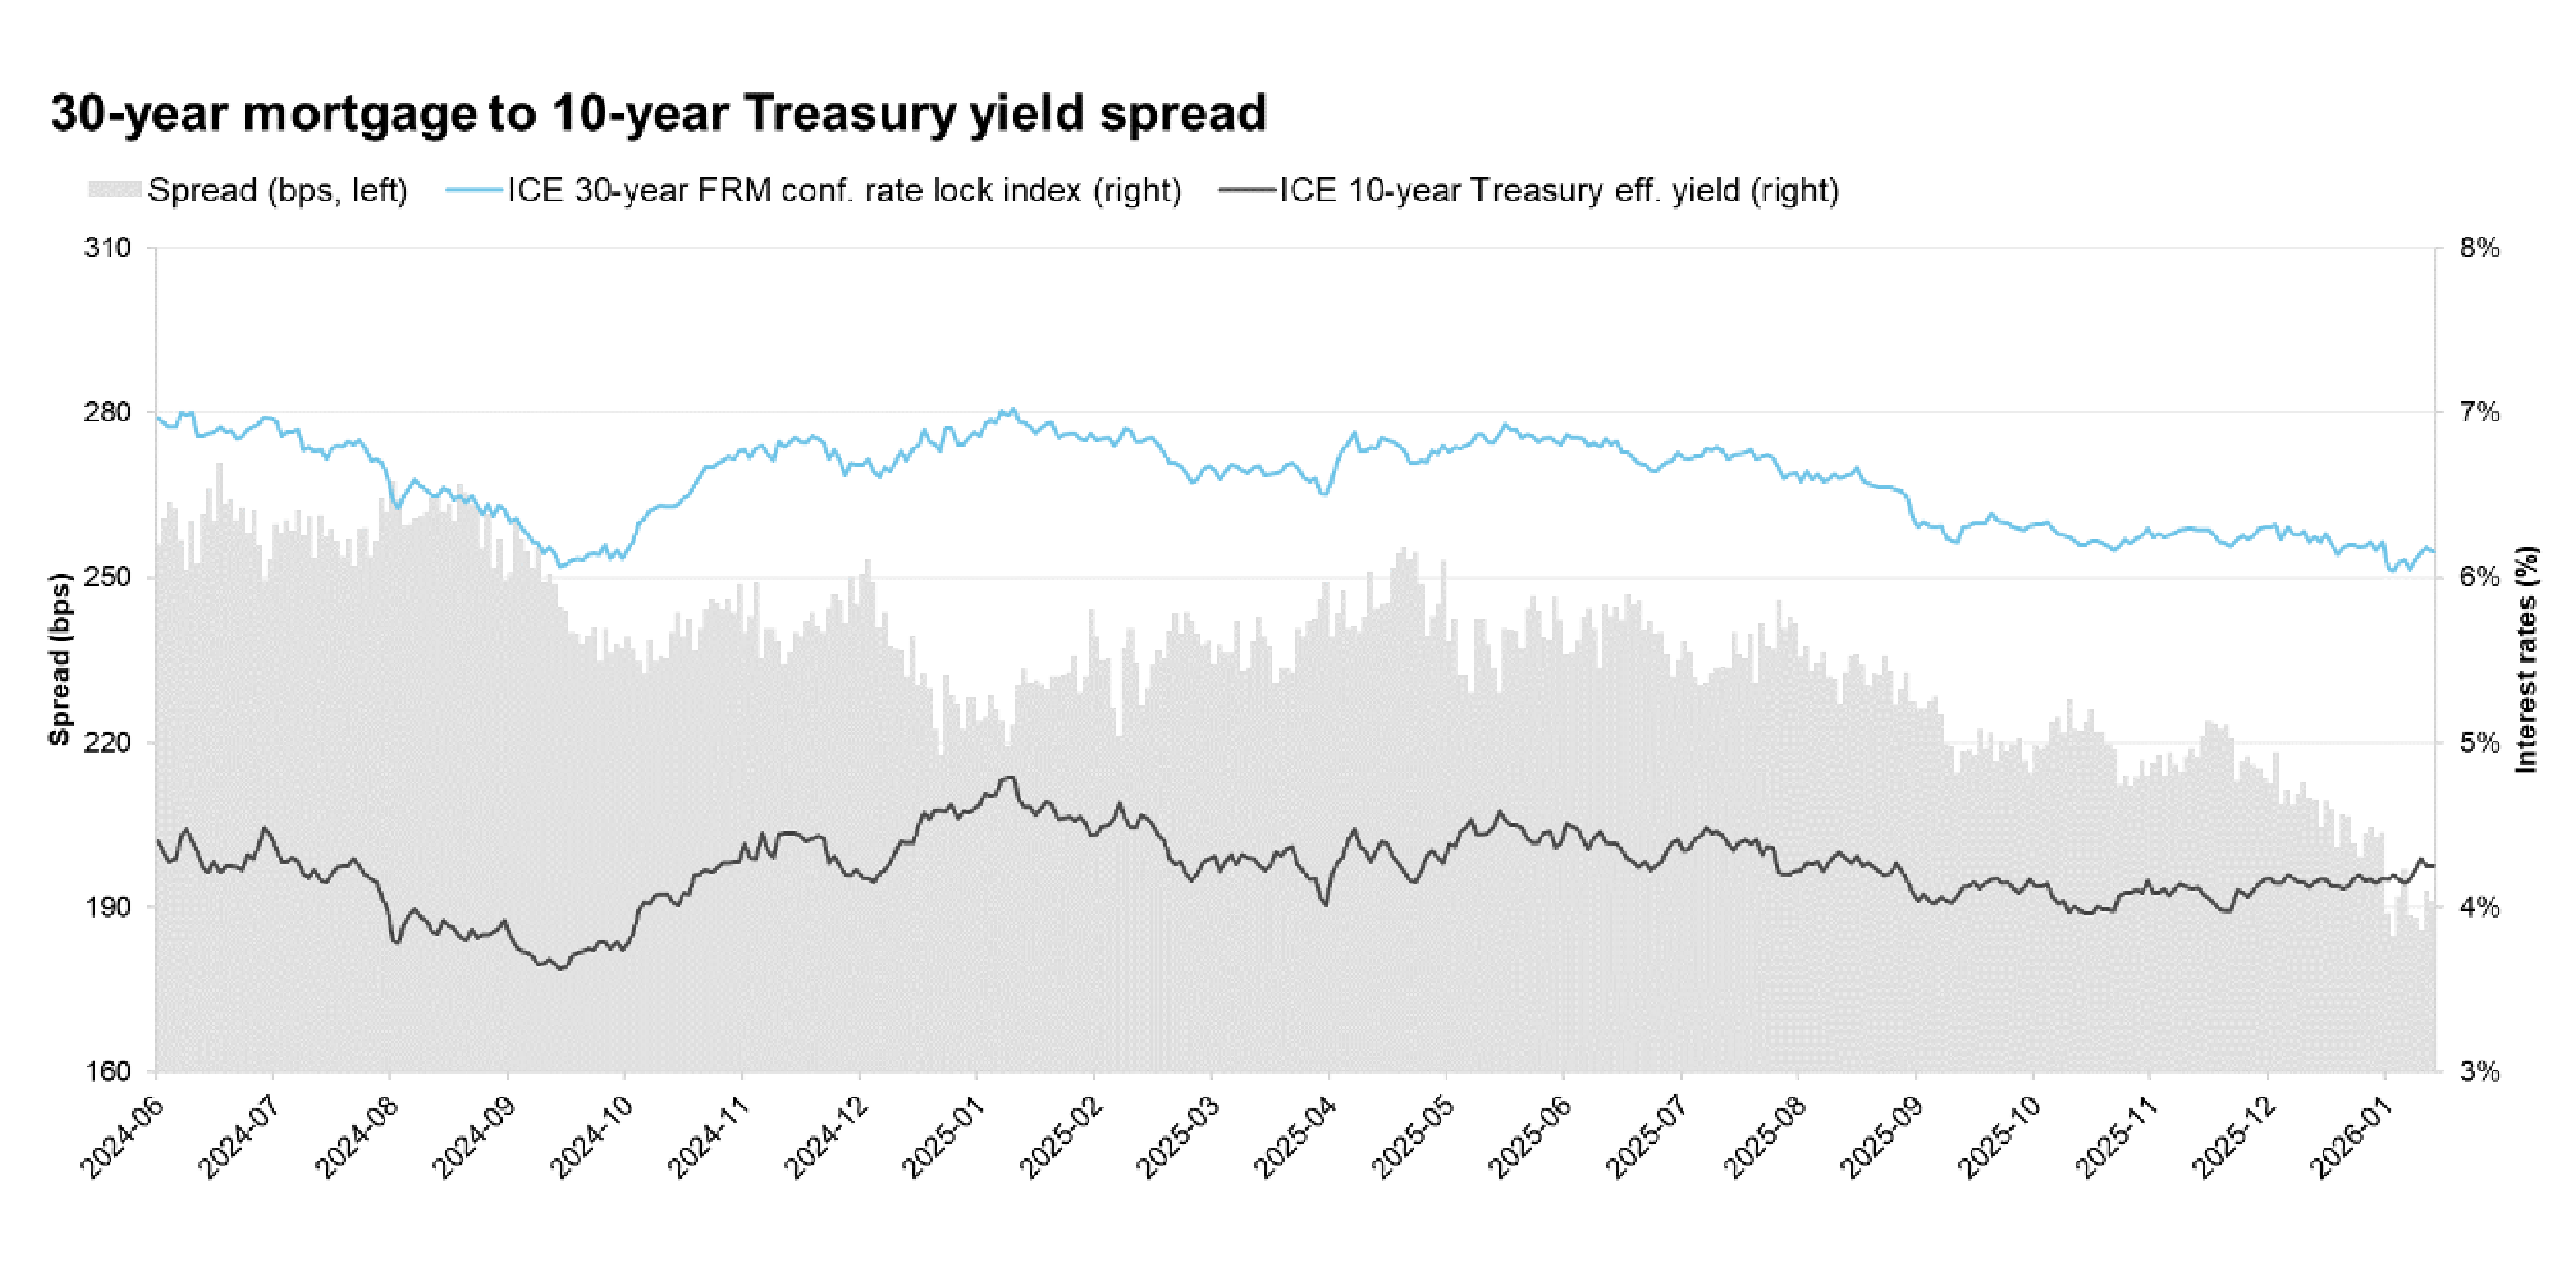
Positive market reactions appeared to coincide with this directive. We saw the spread between 30-year mortgage rates and 10-year Treasury yields tighten to 185 basis points in early January 2026 (Graph C) — the tightest level since early 2022. Consequently, 30-year fixed rates dipped to a nearly three-year low, hovering in the low 6% range (Graph D).
Graph C** - Source: ICE Index Platform
Graph D*** - Source: 30C-ICE Conforming 30-year Fixed Mortgage Rate Lock Weighted APR Index Futures
The "in the money" population
This rate shift has an outsized impact on refinance potential. In early January, approximately 4.8 million borrowers became "in the money" for a refinance — the highest level in nearly four years (Graph E).
The target demographic for these refinances is highly specific — a crucial consideration for title companies. The "rate and term" refinance market is dominated by borrowers who purchased their homes between 2023 and 2025.
Why these vintages? Because the most popular interest rate for homes purchased in recent years was between 6.875% and 6.99%. With rates dipping into the low 6% range, these recent homebuyers can shave meaningful amounts off their monthly payments. In fact, 95% of rate/term refinances in late 2025 came from borrowers refinancing out of 2023-2025 vintage loans. (Graph F)
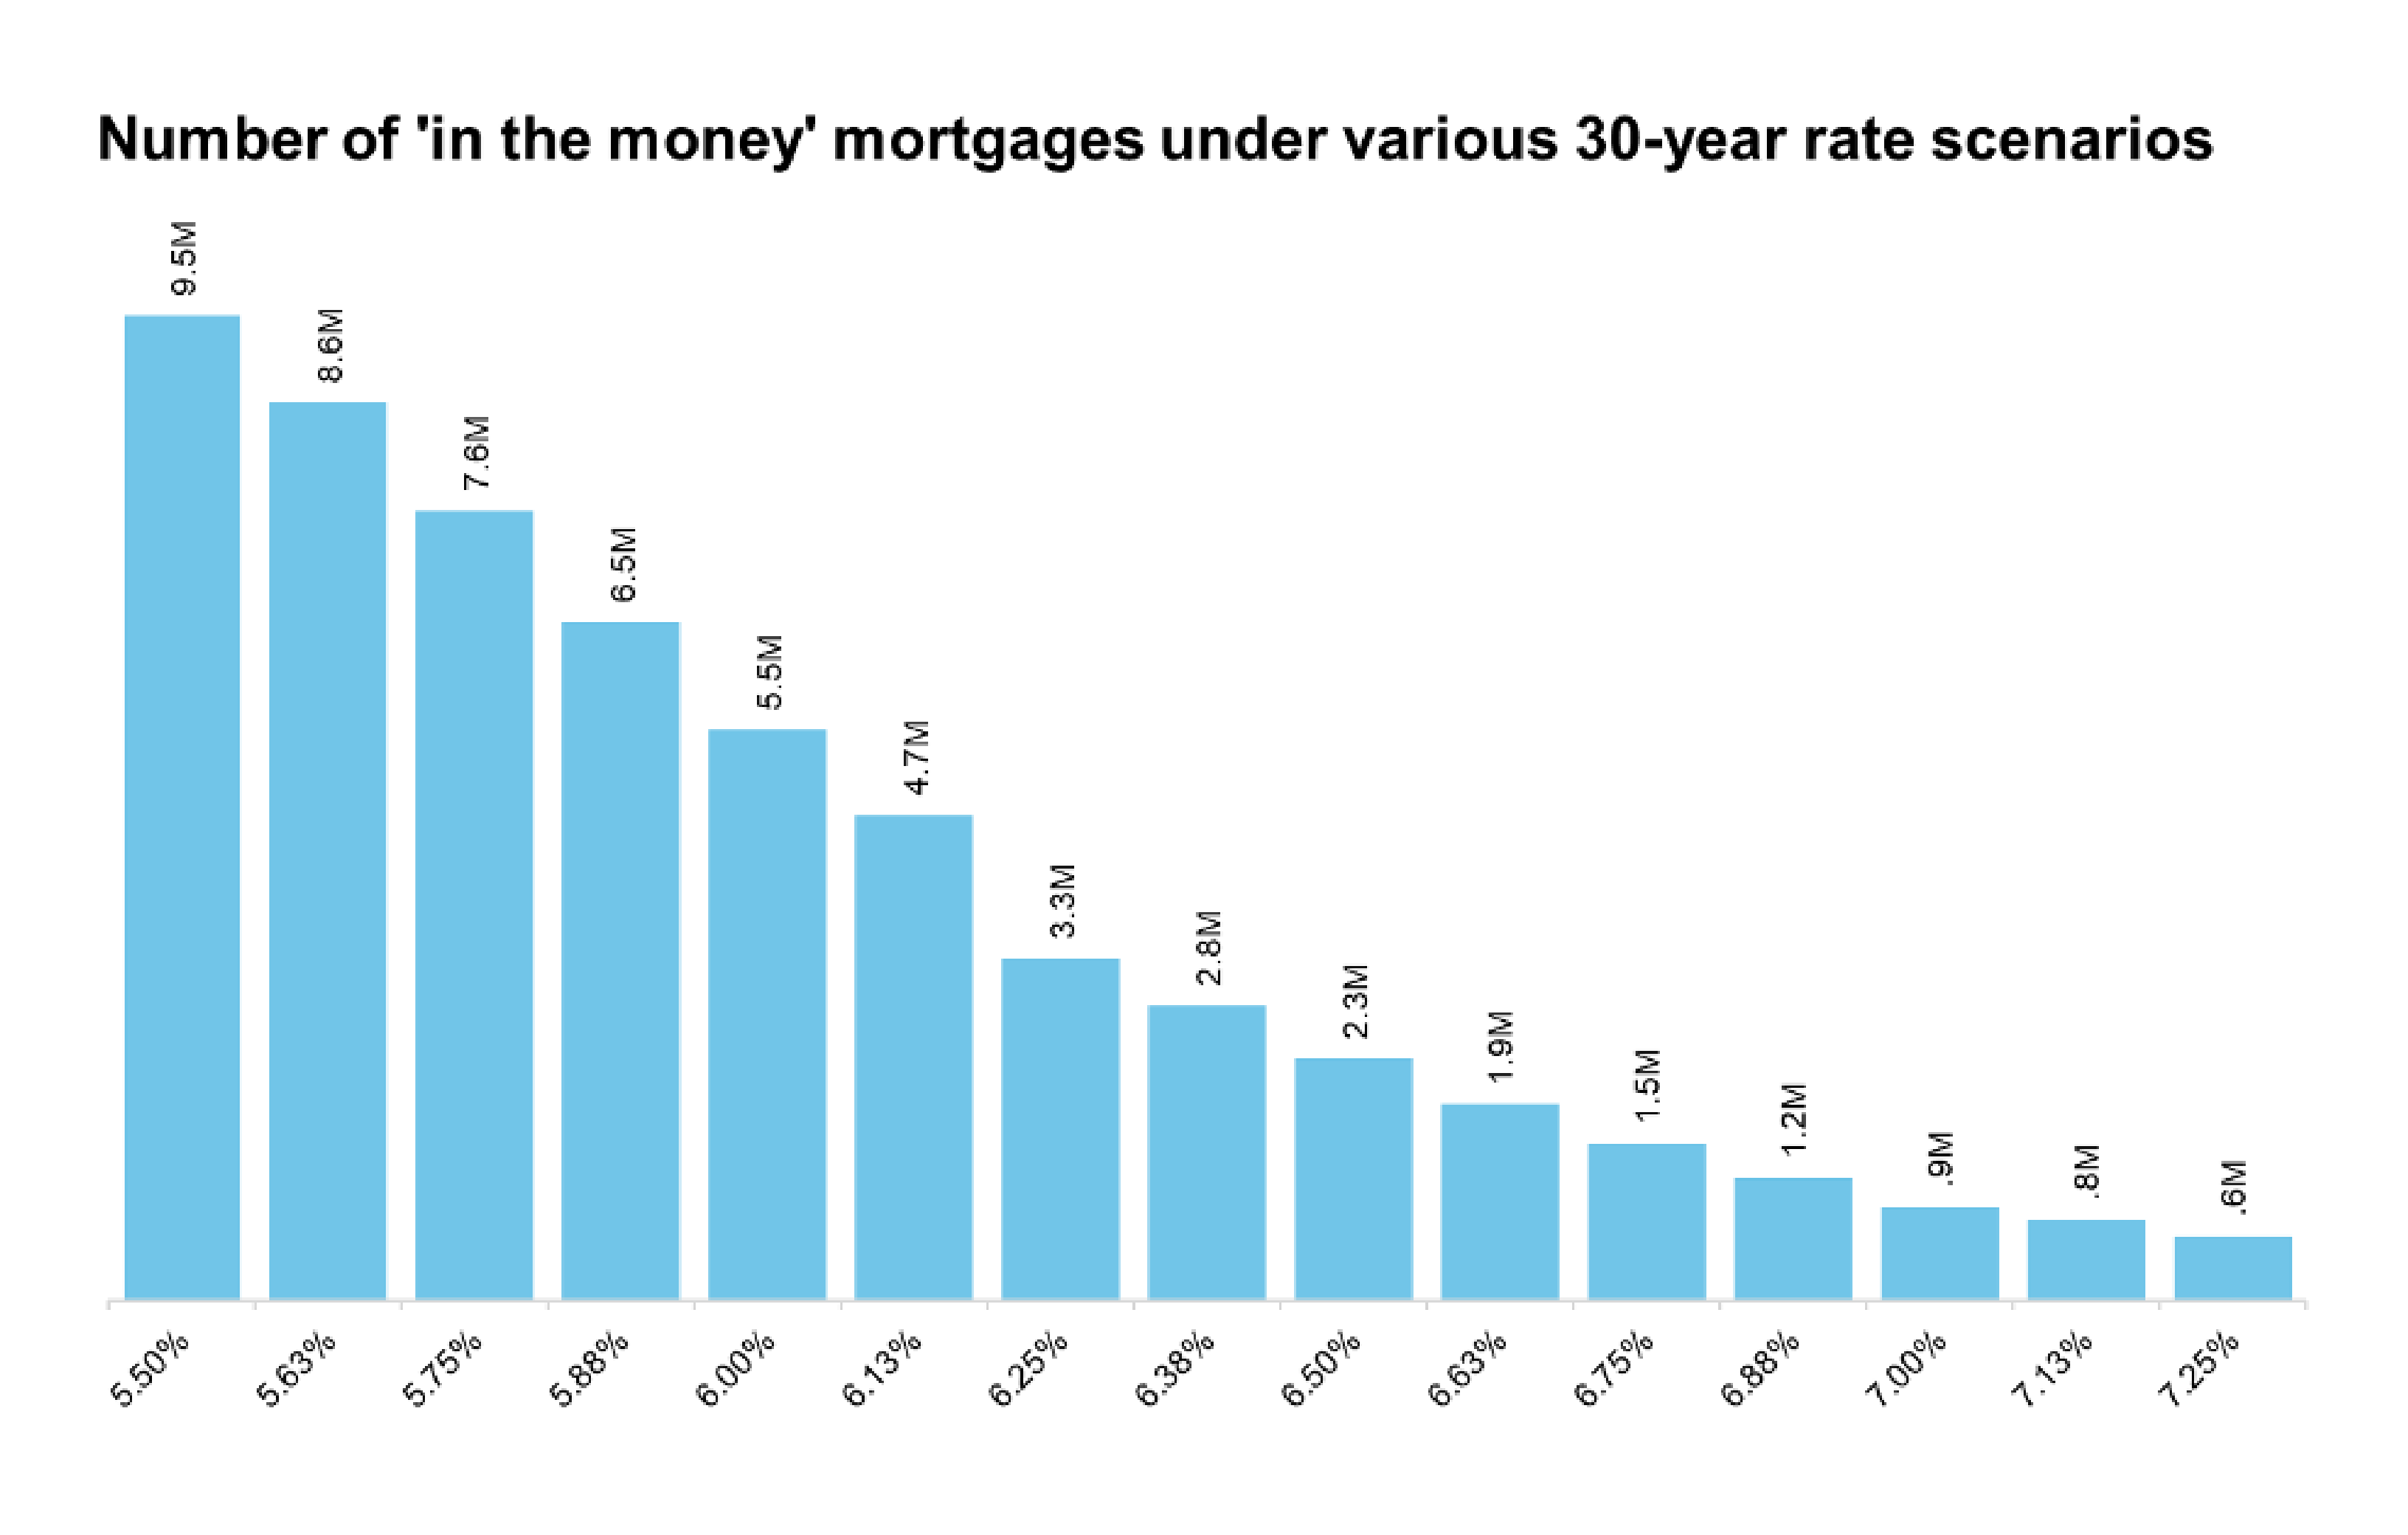
Graph E - Source: ICE McDash
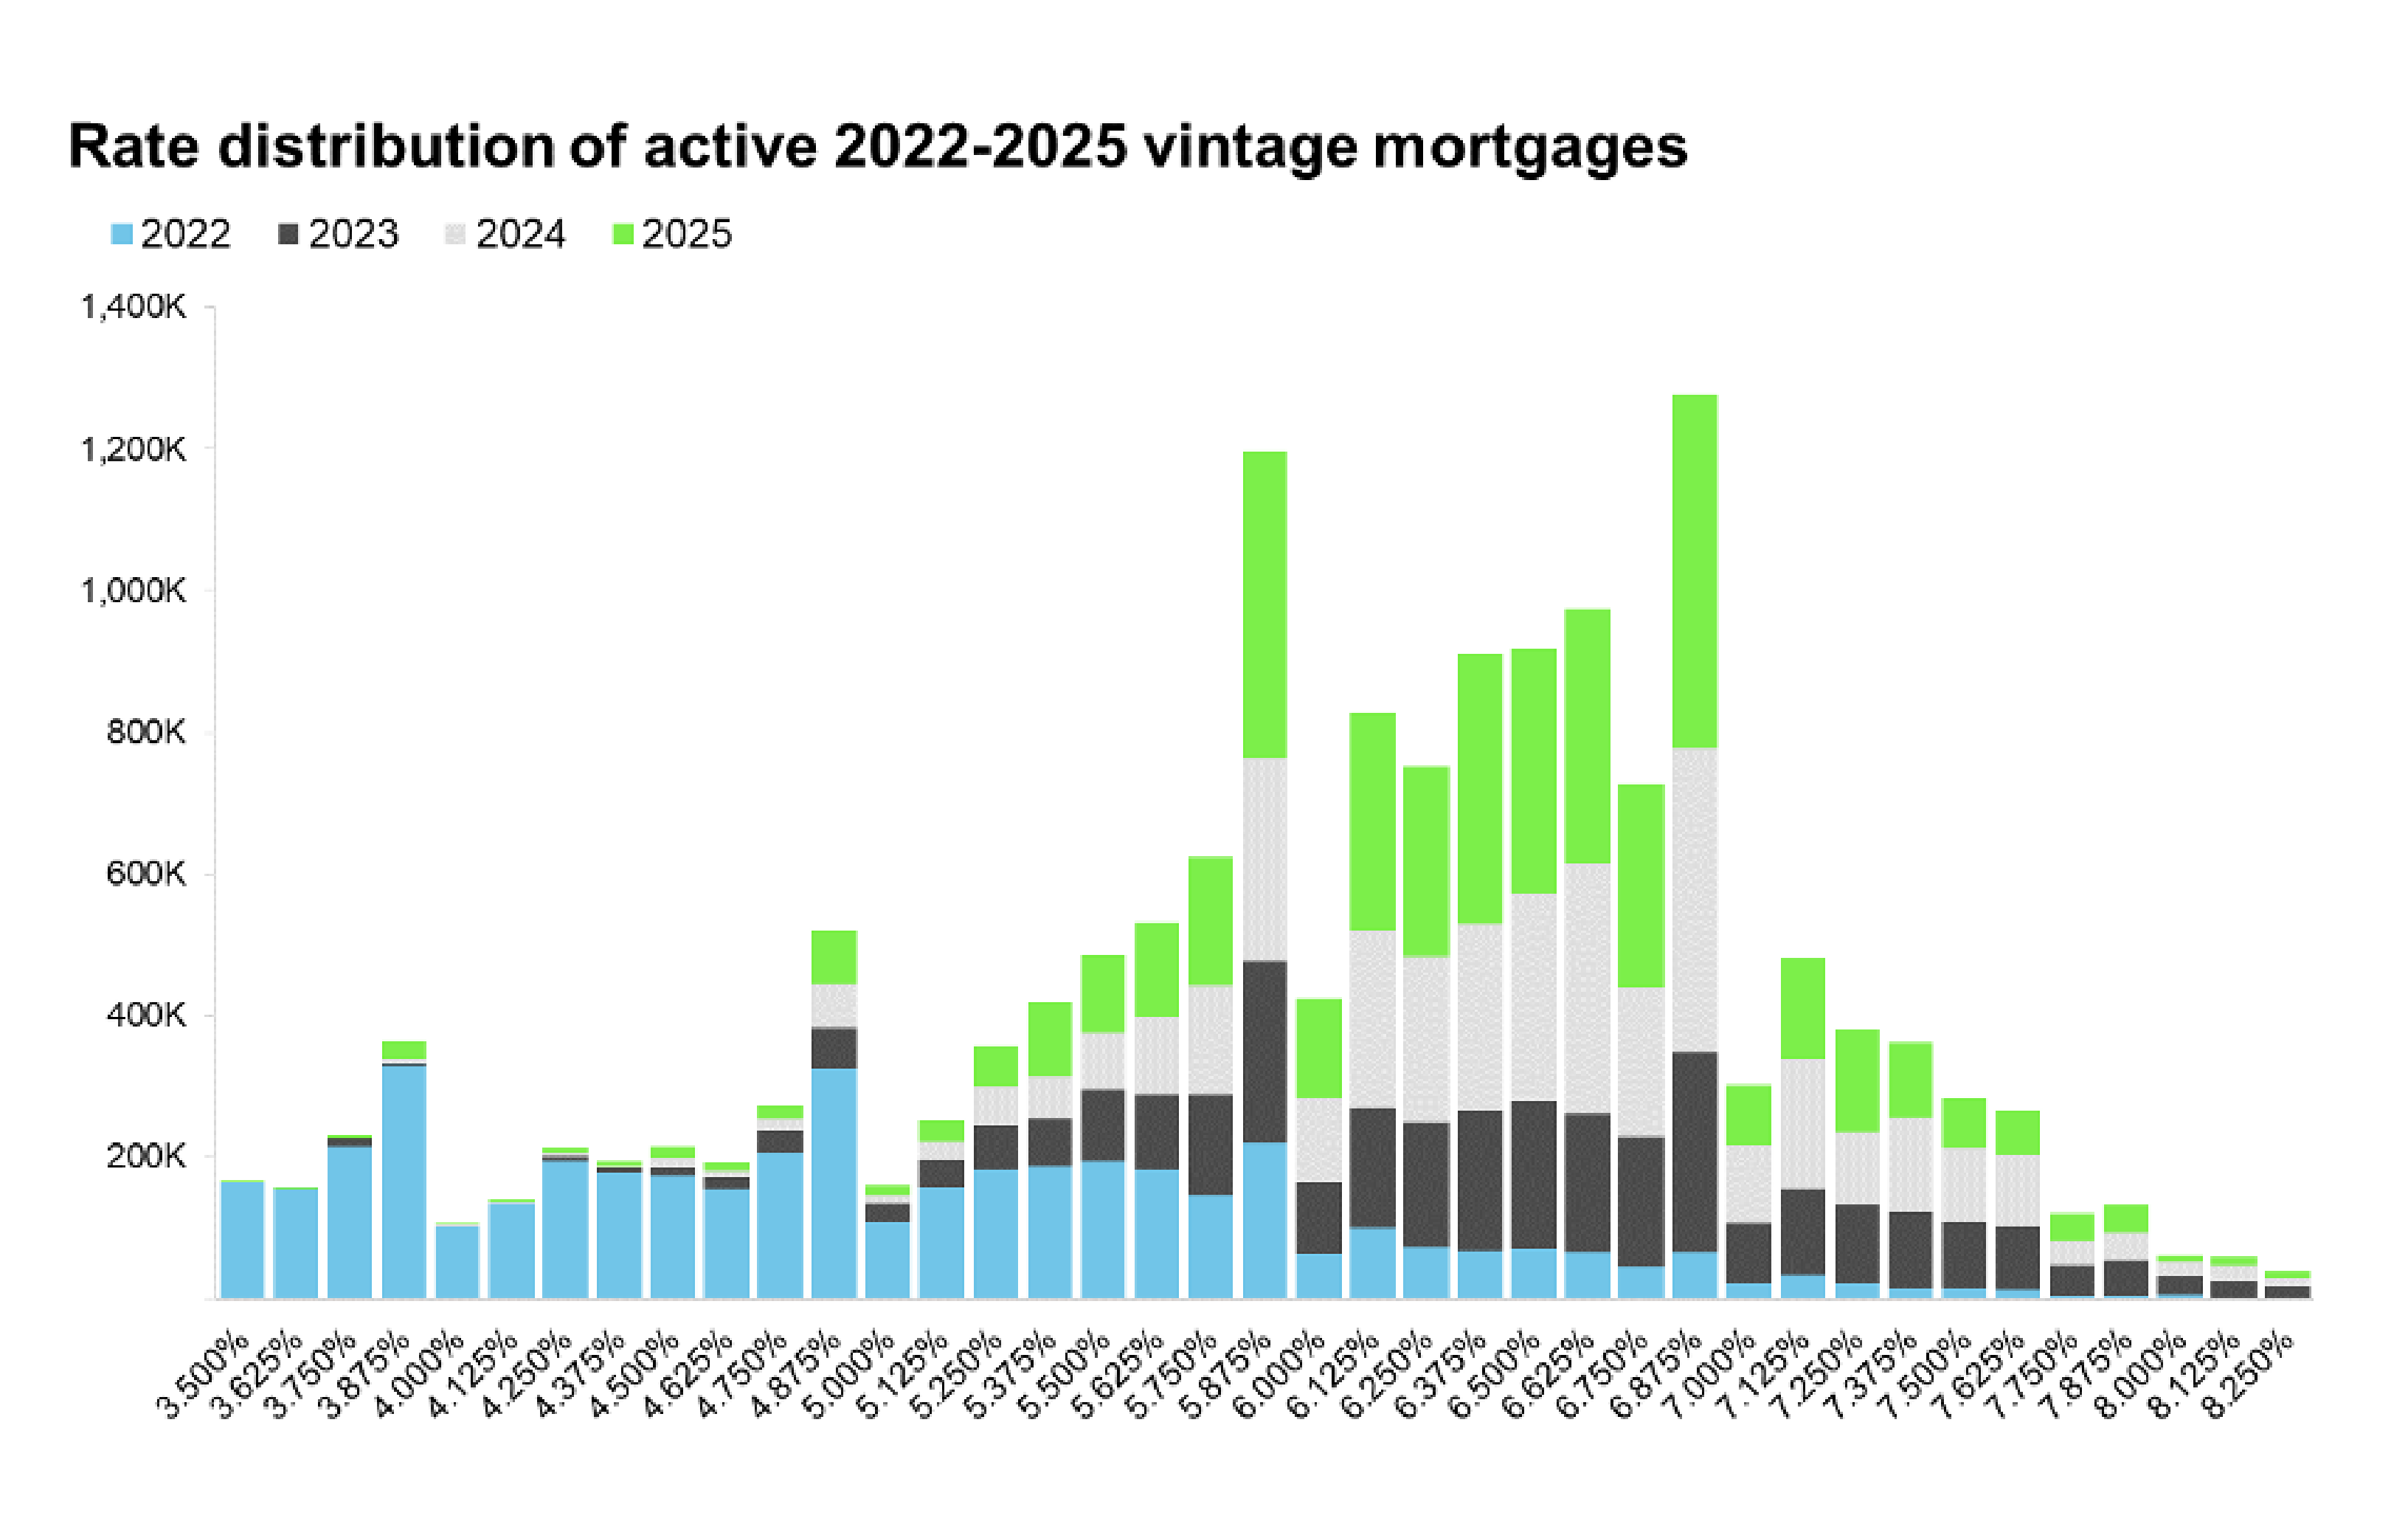
Graph F - Source: ICE McDash
Preparing for volume
And we’re already seeing the results from this rise in refinances with applications hitting a 17-week high in mid-January (Graph G). For title agencies, this means a potential influx of refinance orders. But these transactions often come with lower margins than purchase deals and require speedy delivery.
Lenders dealing with these volume spikes may prioritize title partners who can offer efficient, seamless integration. Title companies that can automate the setup and search process for these standard refinance transactions will be best positioned to capitalize on this "mini boom" without overextending their operational capacity.
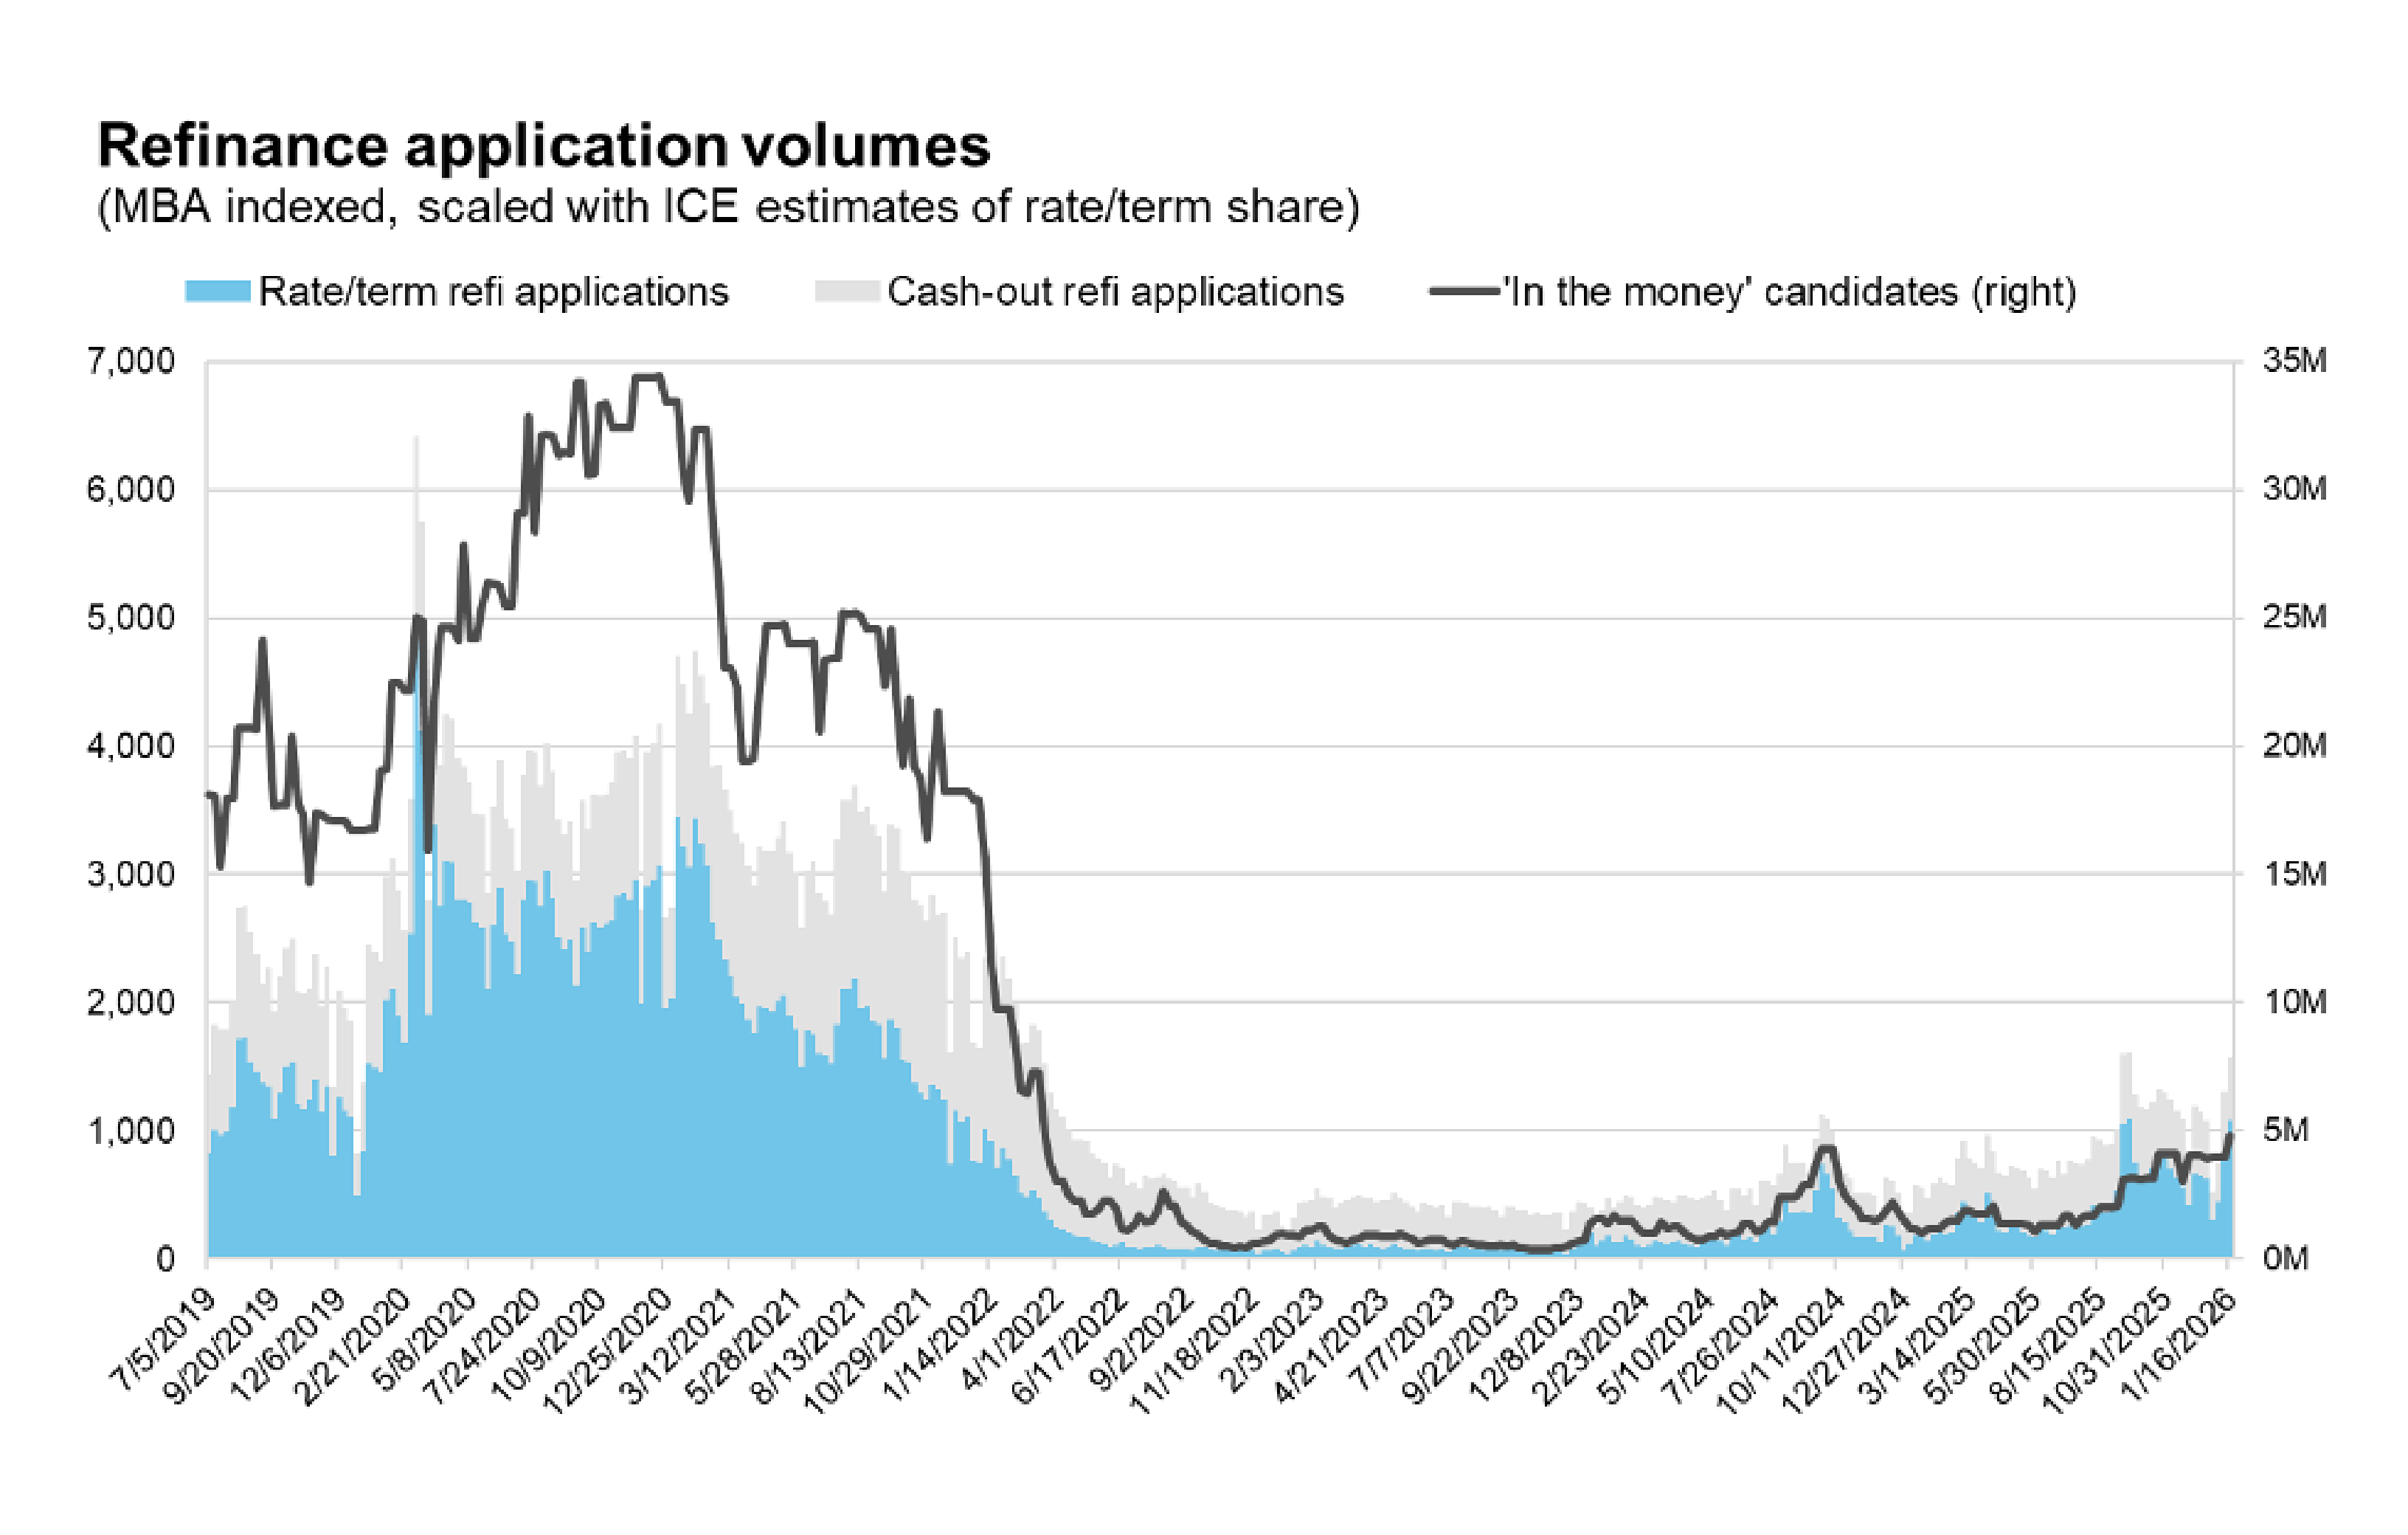
Graph G - Source: ICE Origination Data, MBA
3. The surge in second lien equity extraction
Homeowners’ utilization of equity is the third major trend impacting the title industry. After years of rapid growth, tappable home equity has begun to plateau as home price appreciation cools. However, the extraction of that equity is hitting multi-year highs.
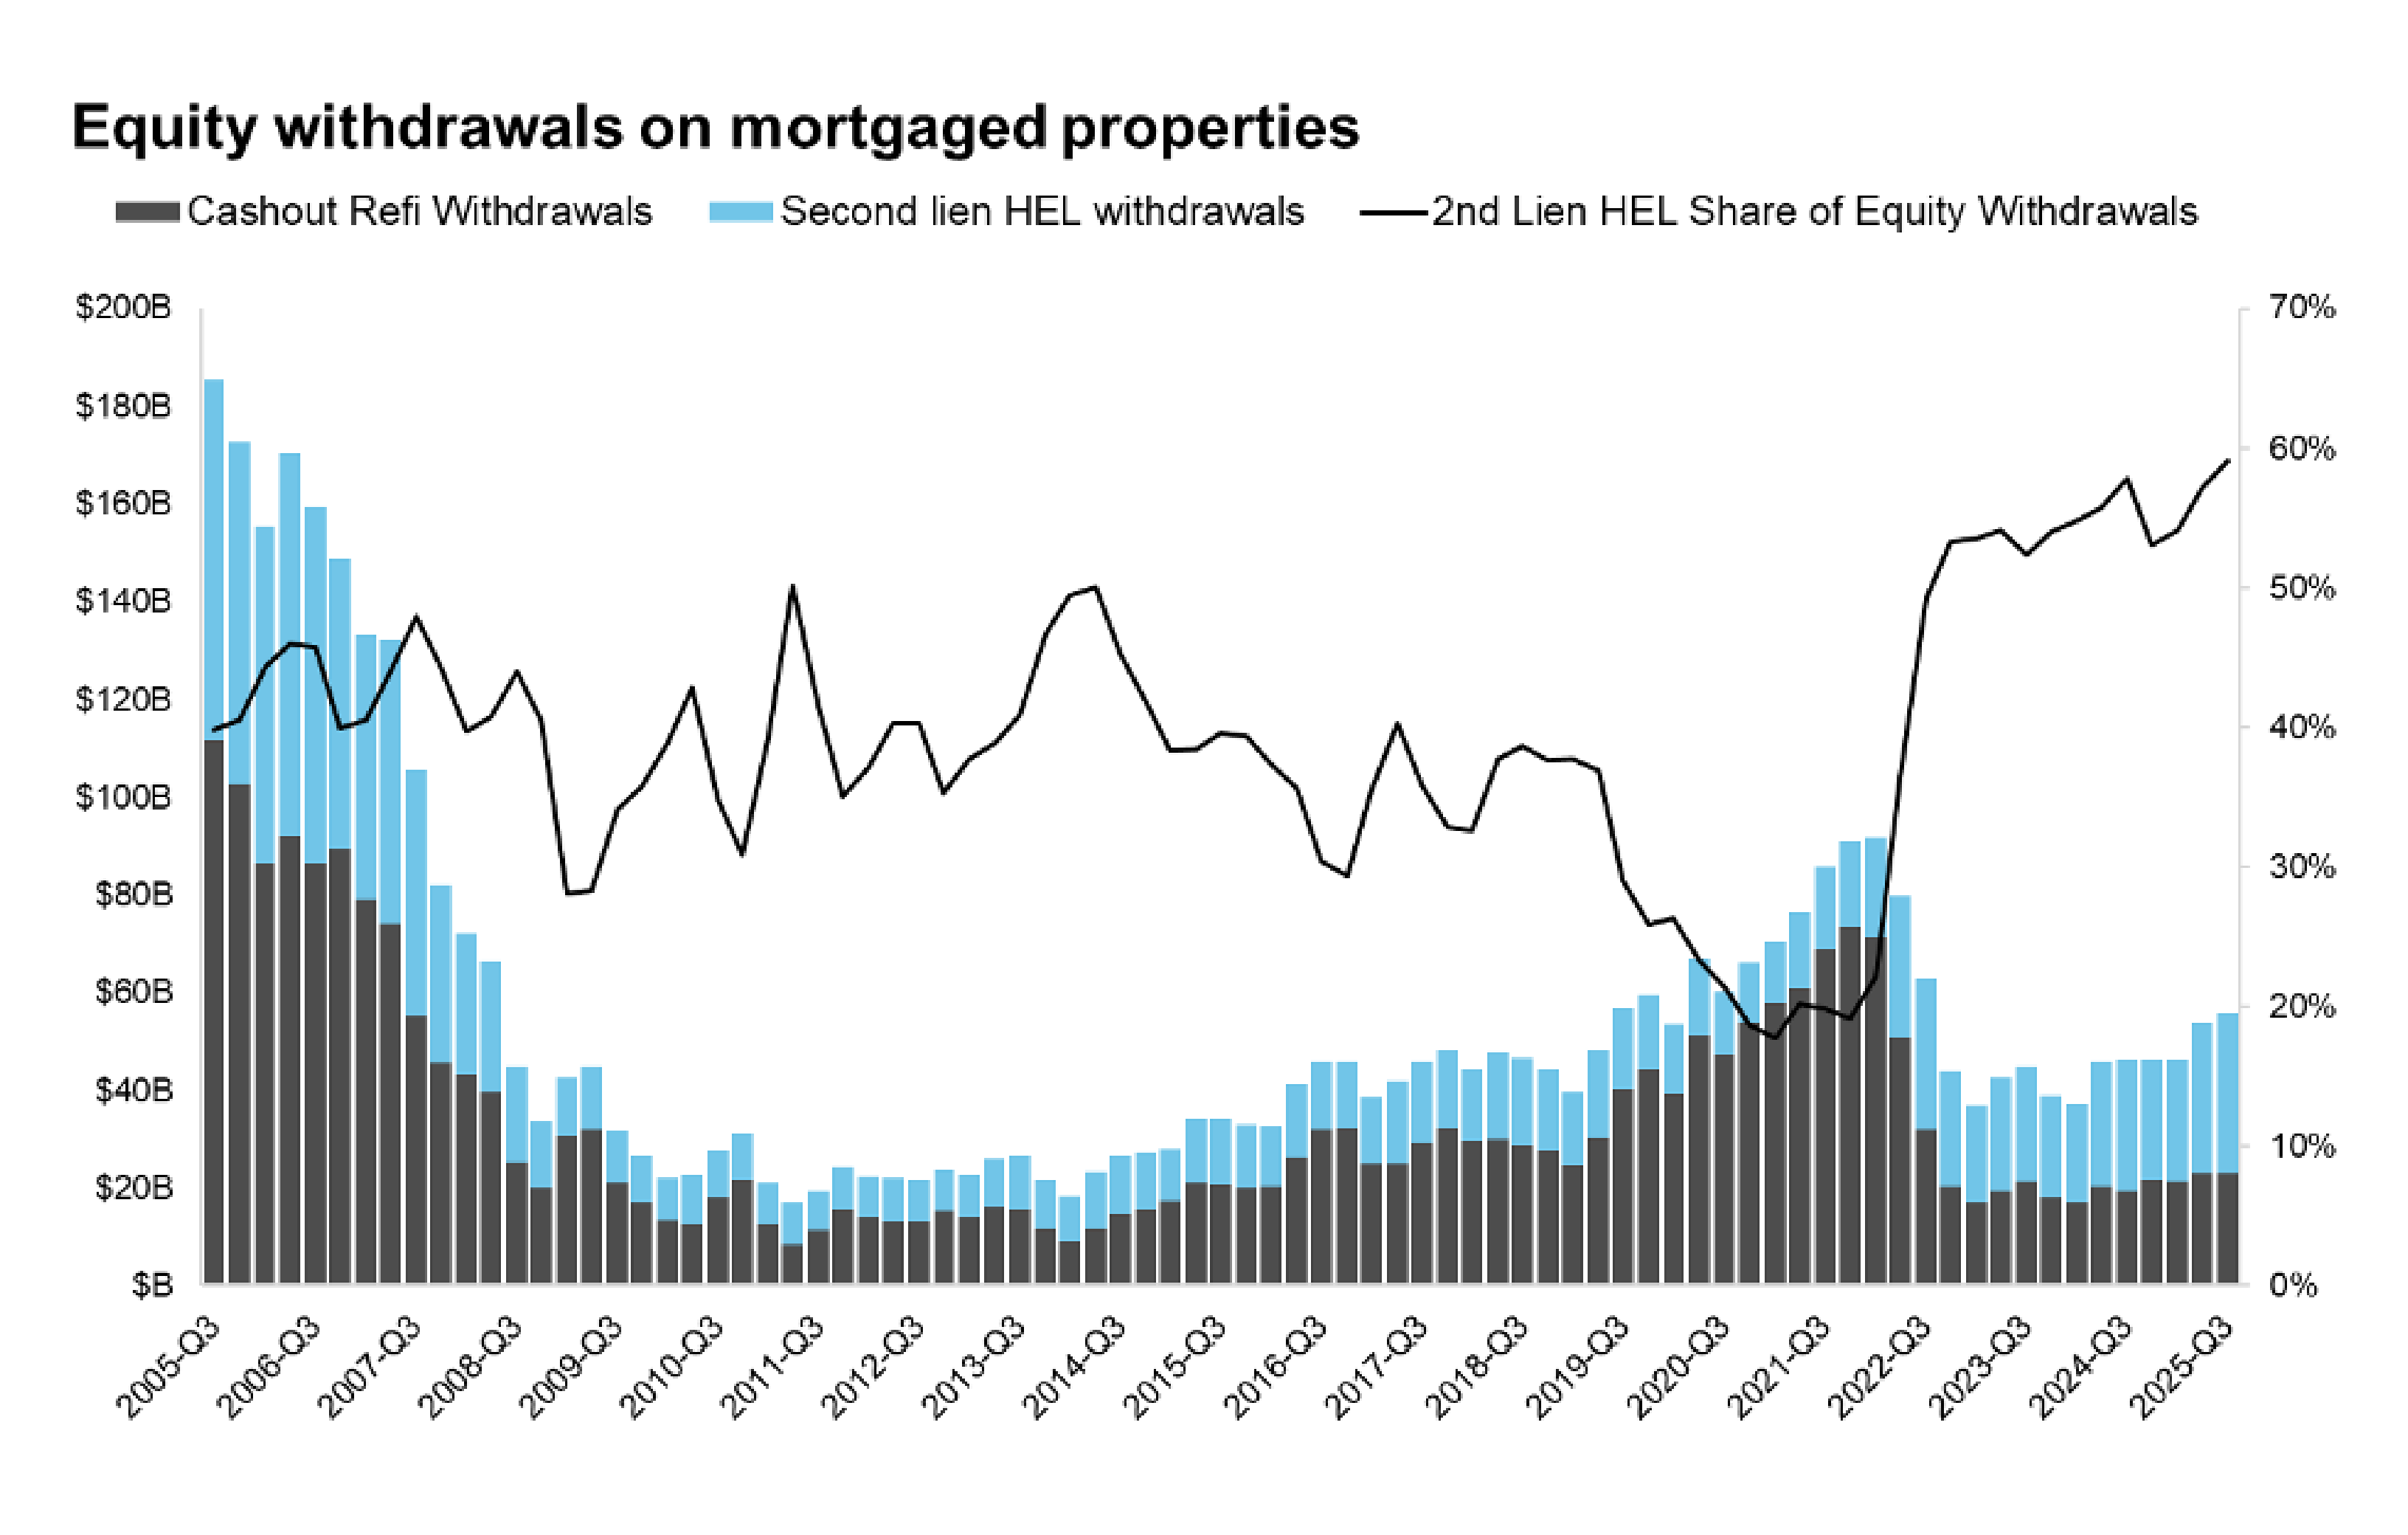
Homeowners are increasingly turning to second liens (like HELOCs and home equity loans) rather than cash-out refinances to access their wealth. In Q3 2025, second lien equity withdrawals hit approximately $33 billion — the highest level since 2007 (Graph H).
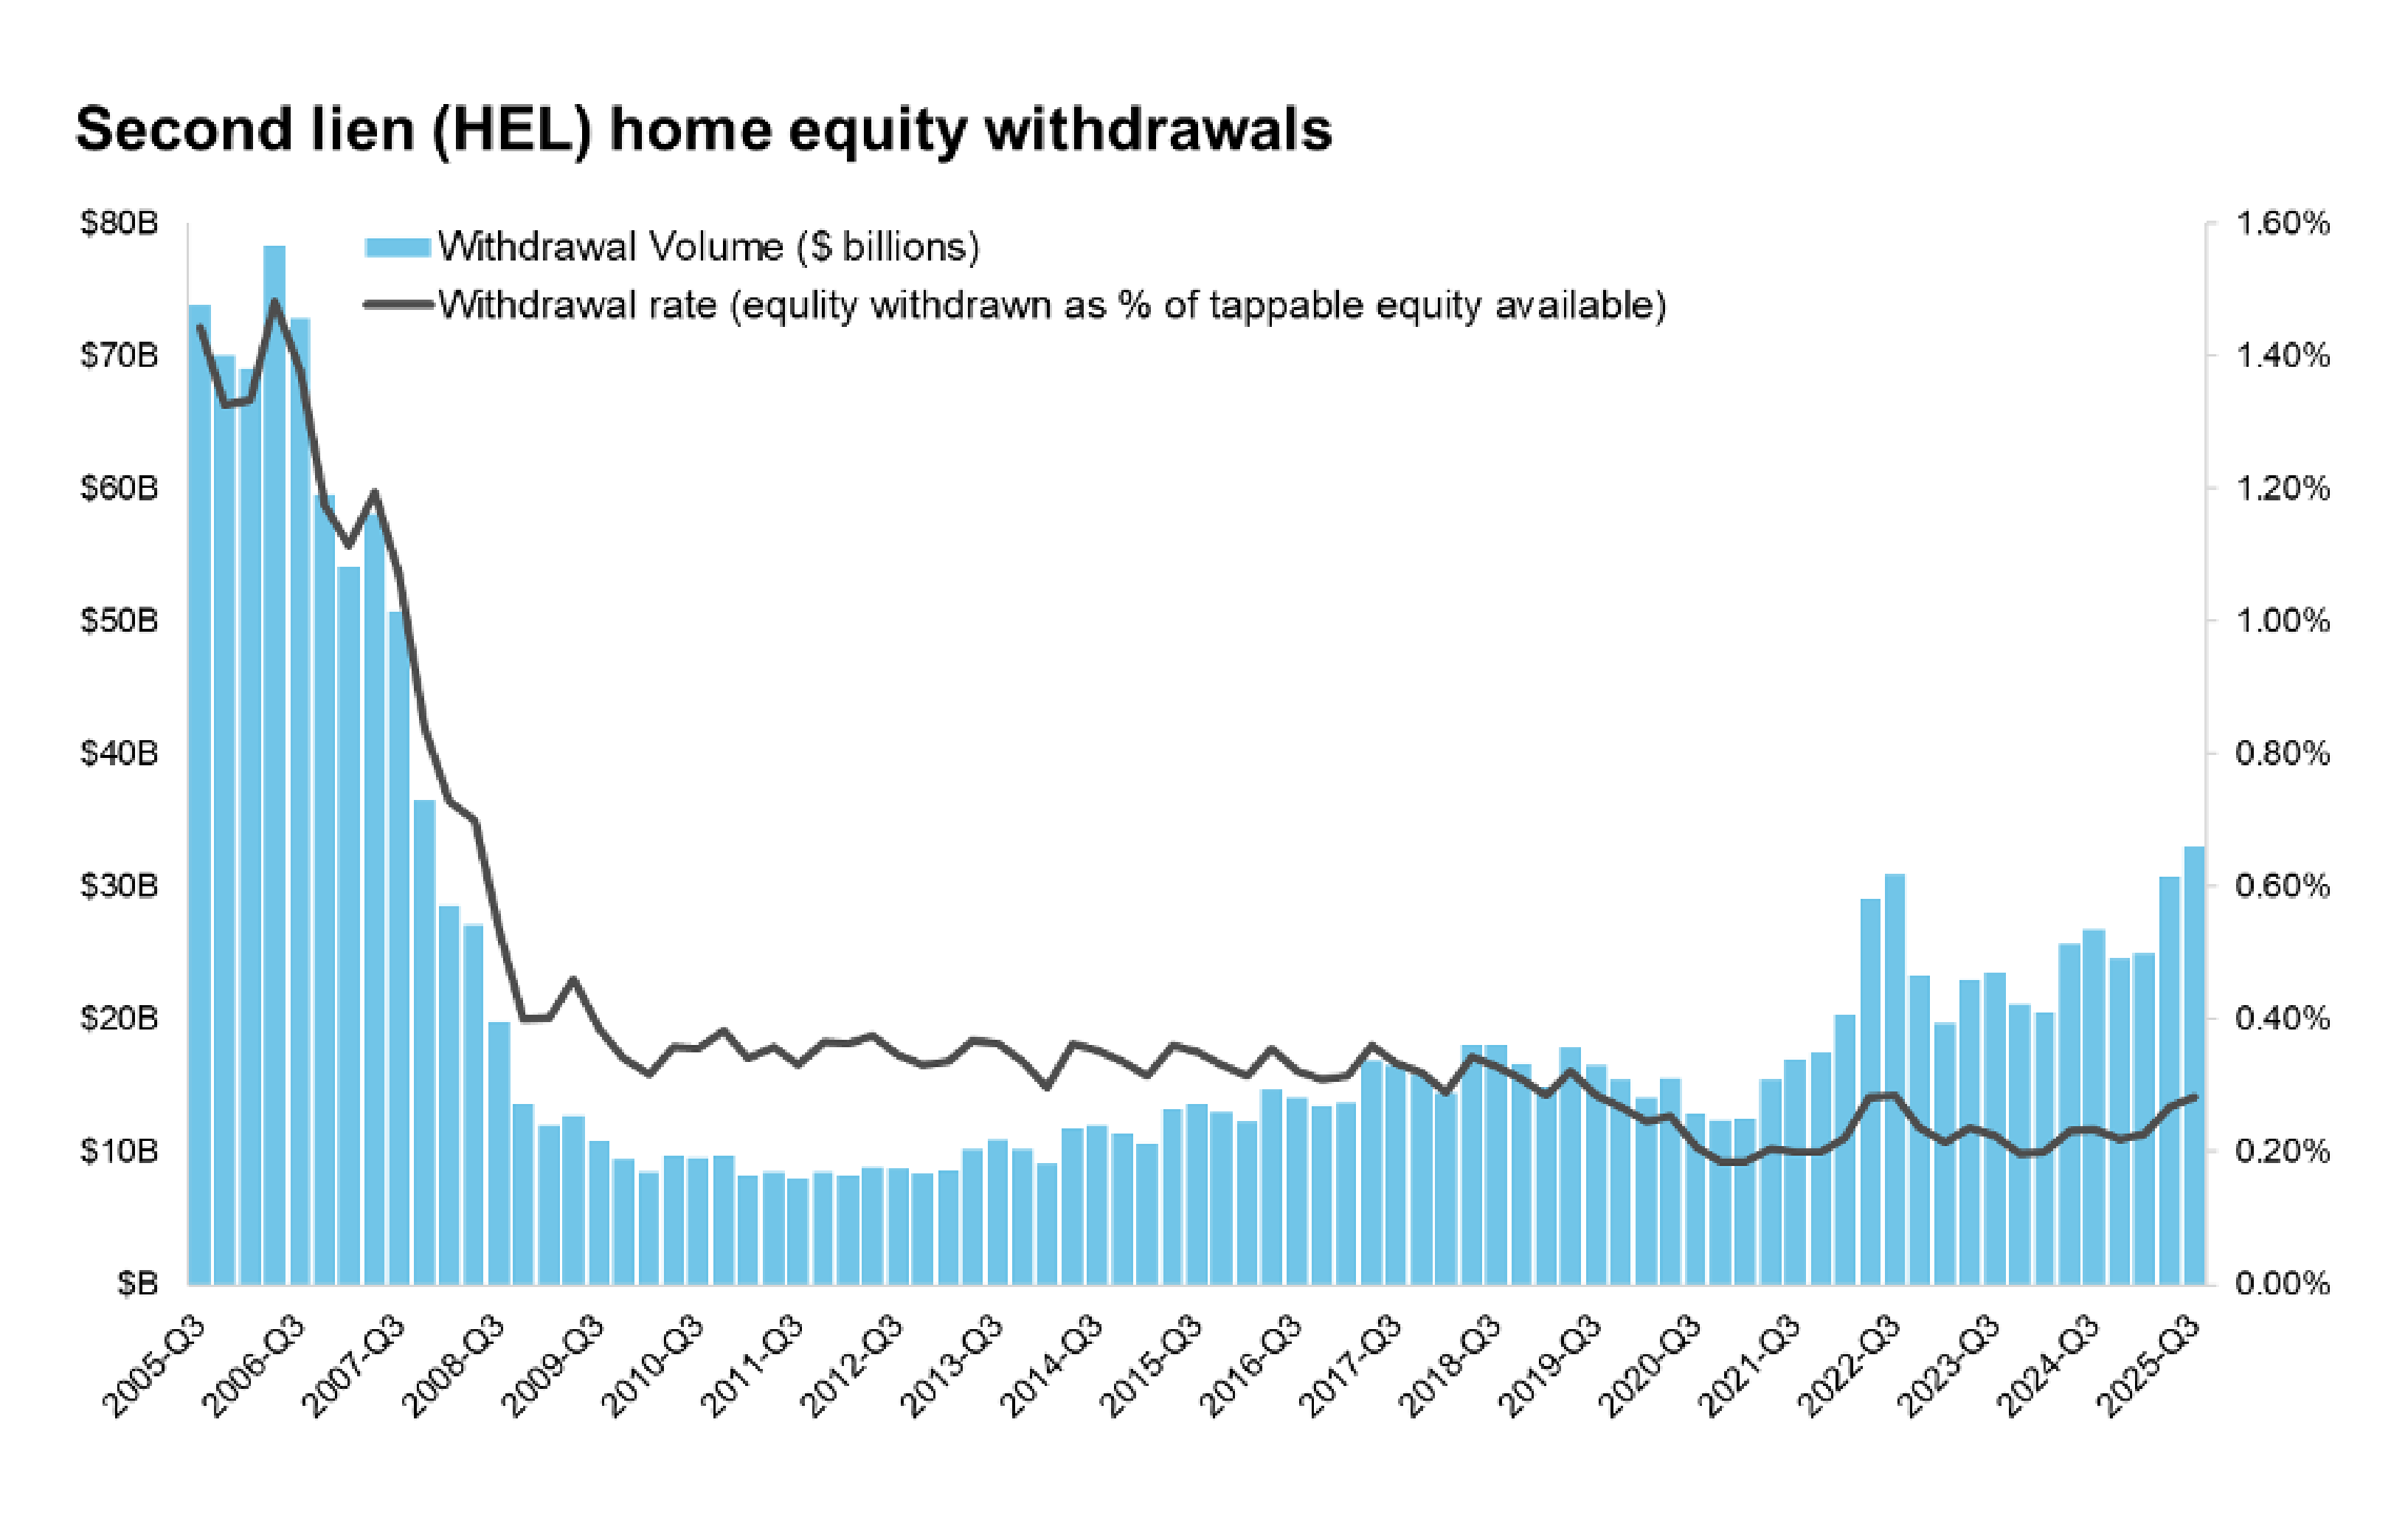
Graph H - Source: ICE McDash + Property
Why second liens are winning
The logic for borrowers is simple: math. With first-lien mortgage rates still higher than the 3-4% rates many homeowners locked in years ago, trading a low rate for a higher one via a cash-out refinance is unappealing.
Conversely, the cost to borrow against equity via a second lien is falling. As Fed expectations shift and Treasury yields fluctuate, the monthly payment needed to withdraw $50,000 of equity has dropped by more than $100/month from recent highs (Graph I).
Second liens accounted for 59% of all equity withdrawals in Q3 2025 (Graph J). If the Federal Reserve moves forward with additional rate cuts later this year, the cost of HELOCs (which are often tied to prime rates) could drop further, fueling even more demand.
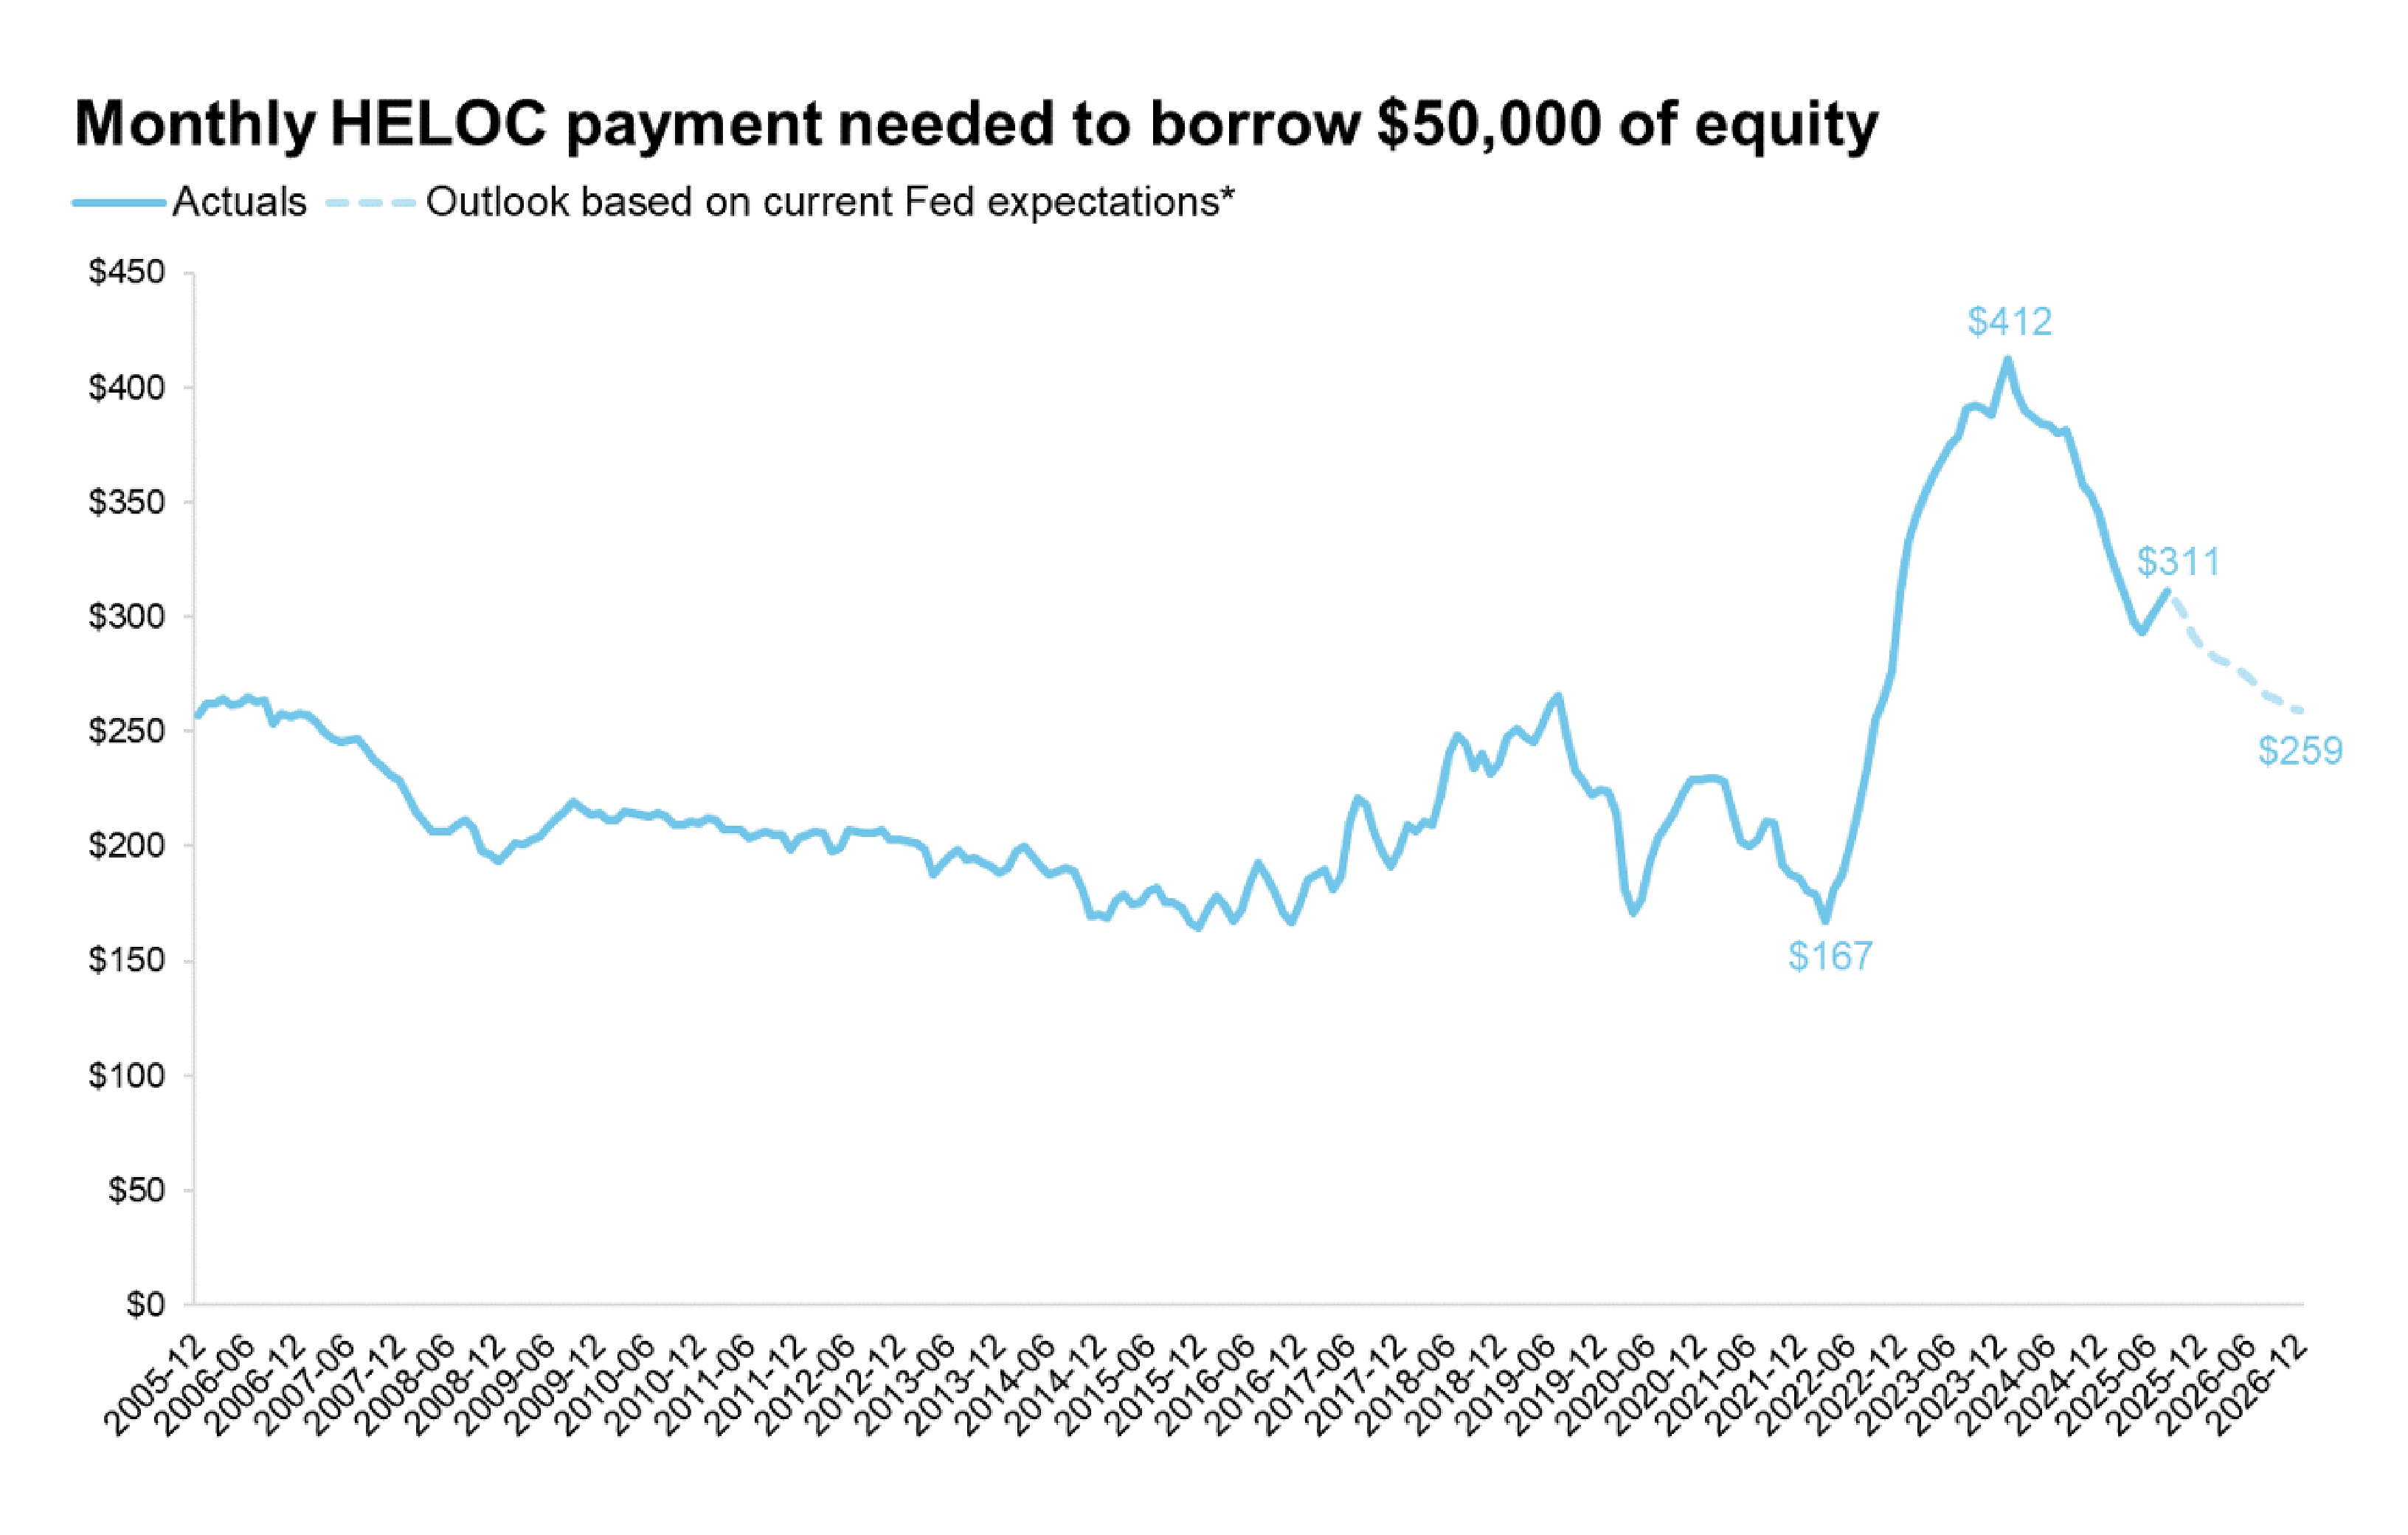
Graph I - Source: ICE McDash + Property
Graph J - Source: ICE McDash + Property
The title opportunity
The rise of the second lien market presents a distinct opportunity for title companies to diversify revenue streams. Second liens typically require faster turnaround times and different products (often junior lien policies or property reports) - a distinct difference in comparison to full refinances.
Lenders proactively [or actively] marketing HELOCs need partners who can verify ownership and lien position quickly. Title companies that have streamlined workflows for junior liens — and the technology to integrate these orders directly from lenders' Loan Origination Systems (LOS) — should see increased volume from this sector.
Adapting to a fragmented market
The 2026 mortgage market isn’t defined by a single narrative. It’s a market of specific pockets: rising FHA defaults, a refinance window for recent buyers and a boom in second lien equity extraction.
For title businesses, success this year won’t come from waiting for a rising tide to lift all boats. Instead, it will come from targeted operational adjustments. Whether it‘s bolstering default services teams, automating refinance workflows to handle sudden volume spikes or refining processes for junior lien products, the data points point clearly to areas of demand.
By aligning your services with these data-driven trends, your title company can more easily [or better] secure a steady flow of business regardless of which direction the broader market turns next.
To get a current view of the mortgage market, subscribe to our complimentary monthly mortgage and housing update: https://mortgagetech.ice.com/explore/ice-monthly-data-reports
* Non-current mortgages are loans 30 or more days past due including loans in active foreclosure
** Data through Jan. 22, 2026
*** Implied 30-year mortgage rate is calculated using the single day spread between the loan balance weighted average APR futures price and simple average daily rate. Data as of Jan. 22, 2026
Related resources
Follow us on Linkedin
Access Mortgage Monitor reports
2026 Borrower Insights Survey report